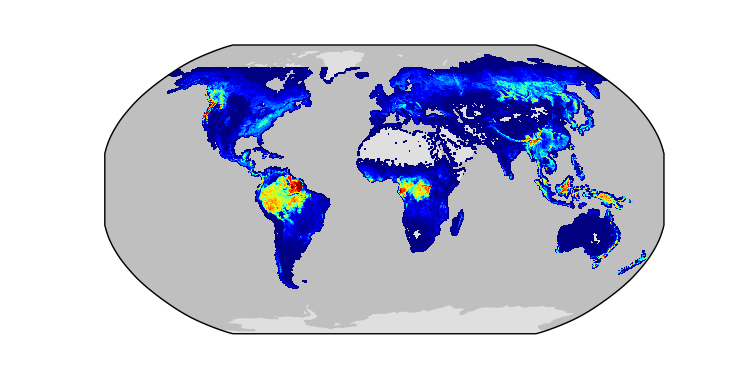
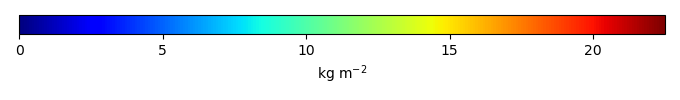
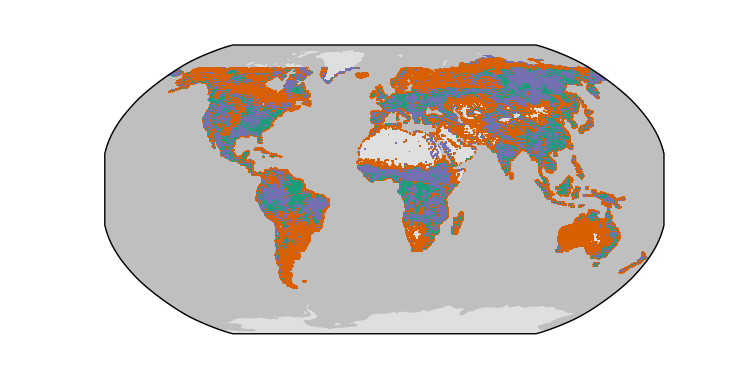
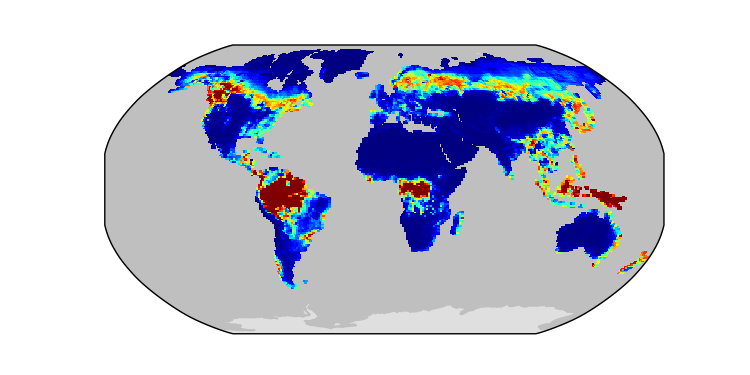
Biomass / GlobalCarbon / 1996-2006 / global / CLM-GSWP3
Global - Land
CLM-CRUJRA
Download Data |
Period Mean (original grids) [Pg] |
Model Period Mean (intersection) [Pg] |
Benchmark Period Mean (intersection) [Pg] |
Model Period Mean (complement) [Pg] |
Benchmark Period Mean (complement) [Pg] |
Bias [kg m-2] |
Bias Score [1] |
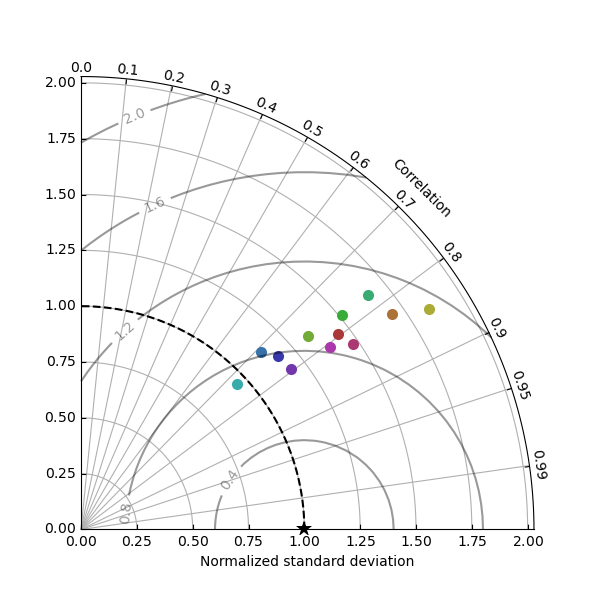
Spatial Distribution Score [1] |
Overall Score [1] |
|||
|---|---|---|---|---|---|---|---|---|---|---|---|---|
| Benchmark | [-] | 48.4 | ||||||||||
| CLM-CRUJRA | [-] | 109. | 107. | 48.3 | 0.182 | 0.0978 | 4.14 | 0.425 | 0.631 | 0.528 | ||
| CLM-GSWP3 | [-] | 89.9 | 89.2 | 48.3 | 0.164 | 0.0978 | 2.86 | 0.431 | 0.663 | 0.547 | ||
| CLM-Princeton | [-] | 139. | 138. | 48.3 | 0.188 | 0.0978 | 6.26 | 0.322 | 0.529 | 0.426 | ||
| ISBA-CTRIP-CRUJRA | [-] | 56.8 | 57.4 | 48.4 | 0.0496 | 0.00568 | 0.647 | 0.602 | 0.904 | 0.753 | ||
| ISBA-CTRIP-GSWP3 | [-] | 50.9 | 51.5 | 48.4 | 0.0464 | 0.00568 | 0.238 | 0.623 | 0.898 | 0.761 | ||
| ISBA-CTRIP-Princeton | [-] | 76.7 | 77.7 | 48.4 | 0.0624 | 0.00568 | 2.07 | 0.553 | 0.799 | 0.676 | ||
| JSBACH-CRUJRA | [-] | 24.6 | 24.7 | 47.5 | 0.0293 | 0.899 | -1.66 | 0.456 | 0.709 | 0.582 | ||
| JSBACH-GSWP3 | [-] | 37.0 | 36.7 | 47.5 | 0.123 | 0.899 | -0.793 | 0.495 | 0.760 | 0.628 | ||
| JSBACH-Princeton | [-] | 47.4 | 48.1 | 47.5 | 0.0601 | 0.899 | 0.0493 | 0.522 | 0.798 | 0.660 | ||
| Mean-CRUJRA | [-] | 62.3 | 64.0 | 48.4 | 0.0963 | 0.00479 | 1.08 | 0.577 | 0.906 | 0.742 | ||
| Mean-GSWP3 | [-] | 57.8 | 59.6 | 48.4 | 0.124 | 0.00479 | 0.773 | 0.571 | 0.888 | 0.730 | ||
| Mean-Princeton | [-] | 86.0 | 88.6 | 48.4 | 0.115 | 0.00479 | 2.79 | 0.536 | 0.870 | 0.703 |
Download Data |
Period Mean (original grids) [Pg] |
Model Period Mean (intersection) [Pg] |
Benchmark Period Mean (intersection) [Pg] |
Model Period Mean (complement) [Pg] |
Benchmark Period Mean (complement) [Pg] |
Bias [kg m-2] |
Bias Score [1] |
Spatial Distribution Score [1] |
Overall Score [1] |
|||
|---|---|---|---|---|---|---|---|---|---|---|---|---|
| Benchmark | [-] | 364. | ||||||||||
| CLM-CRUJRA | [-] | 721. | 684. | 362. | 31.7 | 2.19 | 2.62 | 0.507 | 0.698 | 0.602 | ||
| CLM-GSWP3 | [-] | 577. | 542. | 362. | 28.4 | 2.19 | 1.46 | 0.573 | 0.786 | 0.679 | ||
| CLM-Princeton | [-] | 812. | 776. | 362. | 32.9 | 2.19 | 3.37 | 0.470 | 0.648 | 0.559 | ||
| ISBA-CTRIP-CRUJRA | [-] | 740. | 671. | 364. | 62.1 | 0.203 | 2.48 | 0.551 | 0.750 | 0.650 | ||
| ISBA-CTRIP-GSWP3 | [-] | 663. | 599. | 364. | 57.9 | 0.203 | 1.90 | 0.604 | 0.811 | 0.708 | ||
| ISBA-CTRIP-Princeton | [-] | 851. | 775. | 364. | 68.3 | 0.203 | 3.33 | 0.519 | 0.695 | 0.607 | ||
| JSBACH-CRUJRA | [-] | 354. | 345. | 337. | 7.09 | 27.2 | 0.0790 | 0.579 | 0.843 | 0.711 | ||
| JSBACH-GSWP3 | [-] | 387. | 378. | 337. | 7.51 | 27.2 | 0.377 | 0.625 | 0.864 | 0.744 | ||
| JSBACH-Princeton | [-] | 453. | 443. | 337. | 7.83 | 27.2 | 0.963 | 0.613 | 0.853 | 0.733 | ||
| Mean-CRUJRA | [-] | 673. | 608. | 364. | 65.0 | 0.369 | 1.97 | 0.590 | 0.814 | 0.702 | ||
| Mean-GSWP3 | [-] | 604. | 544. | 364. | 60.5 | 0.369 | 1.46 | 0.641 | 0.872 | 0.756 | ||
| Mean-Princeton | [-] | 781. | 710. | 364. | 70.3 | 0.369 | 2.80 | 0.563 | 0.788 | 0.676 |
Download Data |
Period Mean (original grids) [Pg] |
Model Period Mean (intersection) [Pg] |
Benchmark Period Mean (intersection) [Pg] |
Model Period Mean (complement) [Pg] |
Benchmark Period Mean (complement) [Pg] |
Bias [kg m-2] |
Bias Score [1] |
Spatial Distribution Score [1] |
Overall Score [1] |
|||
|---|---|---|---|---|---|---|---|---|---|---|---|---|
| Benchmark | [-] | 2.80 | ||||||||||
| CLM-CRUJRA | [-] | 7.32 | 5.73 | 2.73 | 1.03 | 0.0754 | 0.192 | 0.508 | 0.706 | 0.607 | ||
| CLM-GSWP3 | [-] | 5.05 | 4.06 | 2.73 | 0.707 | 0.0754 | 0.0839 | 0.488 | 0.669 | 0.578 | ||
| CLM-Princeton | [-] | 6.55 | 5.07 | 2.73 | 0.871 | 0.0754 | 0.150 | 0.518 | 0.697 | 0.608 | ||
| ISBA-CTRIP-CRUJRA | [-] | 9.97 | 8.30 | 2.79 | 1.52 | 0.0125 | 0.356 | 0.454 | 0.270 | 0.362 | ||
| ISBA-CTRIP-GSWP3 | [-] | 9.20 | 7.90 | 2.79 | 1.18 | 0.0125 | 0.332 | 0.469 | 0.306 | 0.387 | ||
| ISBA-CTRIP-Princeton | [-] | 11.9 | 10.1 | 2.79 | 1.56 | 0.0125 | 0.470 | 0.415 | 0.212 | 0.314 | ||
| JSBACH-CRUJRA | [-] | 9.92 | 8.72 | 2.52 | 1.18 | 0.279 | 0.435 | 0.473 | 0.439 | 0.456 | ||
| JSBACH-GSWP3 | [-] | 12.1 | 11.1 | 2.52 | 1.05 | 0.279 | 0.602 | 0.465 | 0.323 | 0.394 | ||
| JSBACH-Princeton | [-] | 8.97 | 8.01 | 2.52 | 0.817 | 0.279 | 0.386 | 0.493 | 0.446 | 0.469 | ||
| Mean-CRUJRA | [-] | 10.5 | 8.44 | 2.80 | 1.86 | 0.00844 | 0.353 | 0.515 | 0.385 | 0.450 | ||
| Mean-GSWP3 | [-] | 10.2 | 8.47 | 2.80 | 1.42 | 0.00844 | 0.355 | 0.514 | 0.482 | 0.498 | ||
| Mean-Princeton | [-] | 10.9 | 8.80 | 2.80 | 1.79 | 0.00844 | 0.376 | 0.498 | 0.327 | 0.412 |
Download Data |
Period Mean (original grids) [Pg] |
Model Period Mean (intersection) [Pg] |
Benchmark Period Mean (intersection) [Pg] |
Model Period Mean (complement) [Pg] |
Benchmark Period Mean (complement) [Pg] |
Bias [kg m-2] |
Bias Score [1] |
Spatial Distribution Score [1] |
Overall Score [1] |
|||
|---|---|---|---|---|---|---|---|---|---|---|---|---|
| Benchmark | [-] | 1.35 | ||||||||||
| CLM-CRUJRA | [-] | 2.73 | 2.41 | 1.35 | 0.340 | 0.00234 | 0.177 | 0.473 | 0.680 | 0.576 | ||
| CLM-GSWP3 | [-] | 2.46 | 2.19 | 1.35 | 0.208 | 0.00234 | 0.150 | 0.476 | 0.639 | 0.557 | ||
| CLM-Princeton | [-] | 3.00 | 2.79 | 1.35 | 0.280 | 0.00234 | 0.242 | 0.486 | 0.642 | 0.564 | ||
| ISBA-CTRIP-CRUJRA | [-] | 2.96 | 2.23 | 1.35 | 0.194 | 7.30e-05 | 0.131 | 0.467 | 0.590 | 0.528 | ||
| ISBA-CTRIP-GSWP3 | [-] | 3.18 | 2.33 | 1.35 | 0.224 | 7.30e-05 | 0.151 | 0.467 | 0.537 | 0.502 | ||
| ISBA-CTRIP-Princeton | [-] | 3.56 | 2.68 | 1.35 | 0.236 | 7.30e-05 | 0.206 | 0.455 | 0.522 | 0.488 | ||
| JSBACH-CRUJRA | [-] | 0.919 | 0.813 | 1.27 | 0.124 | 0.0869 | -0.0811 | 0.437 | 0.266 | 0.351 | ||
| JSBACH-GSWP3 | [-] | 3.64 | 3.12 | 1.27 | 0.449 | 0.0869 | 0.300 | 0.464 | 0.643 | 0.553 | ||
| JSBACH-Princeton | [-] | 1.92 | 1.69 | 1.27 | 0.248 | 0.0869 | 0.0645 | 0.463 | 0.542 | 0.503 | ||
| Mean-CRUJRA | [-] | 1.95 | 1.81 | 1.35 | 0.300 | 0.00237 | 0.0742 | 0.494 | 0.661 | 0.577 | ||
| Mean-GSWP3 | [-] | 2.89 | 2.52 | 1.35 | 0.386 | 0.00237 | 0.188 | 0.515 | 0.673 | 0.594 | ||
| Mean-Princeton | [-] | 2.72 | 2.42 | 1.35 | 0.349 | 0.00237 | 0.172 | 0.504 | 0.699 | 0.602 |
Download Data |
Period Mean (original grids) [Pg] |
Model Period Mean (intersection) [Pg] |
Benchmark Period Mean (intersection) [Pg] |
Model Period Mean (complement) [Pg] |
Benchmark Period Mean (complement) [Pg] |
Bias [kg m-2] |
Bias Score [1] |
Spatial Distribution Score [1] |
Overall Score [1] |
|||
|---|---|---|---|---|---|---|---|---|---|---|---|---|
| Benchmark | [-] | 3.92 | ||||||||||
| CLM-CRUJRA | [-] | 7.62 | 7.11 | 3.70 | 0.217 | 5.43 | 0.551 | 0.879 | 0.715 | |||
| CLM-GSWP3 | [-] | 7.08 | 6.56 | 3.70 | 0.217 | 4.62 | 0.570 | 0.892 | 0.731 | |||
| CLM-Princeton | [-] | 8.85 | 8.21 | 3.70 | 0.217 | 7.40 | 0.501 | 0.884 | 0.693 | |||
| ISBA-CTRIP-CRUJRA | [-] | 5.32 | 4.84 | 3.92 | 0.00461 | 1.67 | 0.580 | 0.834 | 0.707 | |||
| ISBA-CTRIP-GSWP3 | [-] | 5.30 | 4.62 | 3.92 | 0.00461 | 1.33 | 0.608 | 0.845 | 0.727 | |||
| ISBA-CTRIP-Princeton | [-] | 6.67 | 5.79 | 3.92 | 0.00461 | 3.05 | 0.625 | 0.842 | 0.733 | |||
| JSBACH-CRUJRA | [-] | 3.11 | 3.02 | 2.93 | 0.994 | 0.234 | 0.576 | 0.805 | 0.690 | |||
| JSBACH-GSWP3 | [-] | 2.72 | 2.66 | 2.93 | 0.994 | -0.551 | 0.578 | 0.680 | 0.629 | |||
| JSBACH-Princeton | [-] | 4.49 | 3.76 | 2.93 | 0.994 | 1.84 | 0.599 | 0.795 | 0.697 | |||
| Mean-CRUJRA | [-] | 6.91 | 5.71 | 3.91 | 0.0123 | 2.69 | 0.603 | 0.861 | 0.732 | |||
| Mean-GSWP3 | [-] | 6.47 | 5.34 | 3.91 | 0.0123 | 2.13 | 0.621 | 0.825 | 0.723 | |||
| Mean-Princeton | [-] | 8.28 | 6.84 | 3.91 | 0.0123 | 4.36 | 0.621 | 0.895 | 0.758 |
Download Data |
Period Mean (original grids) [Pg] |
Model Period Mean (intersection) [Pg] |
Benchmark Period Mean (intersection) [Pg] |
Model Period Mean (complement) [Pg] |
Benchmark Period Mean (complement) [Pg] |
Bias [kg m-2] |
Bias Score [1] |
Spatial Distribution Score [1] |
Overall Score [1] |
|||
|---|---|---|---|---|---|---|---|---|---|---|---|---|
| Benchmark | [-] | 60.2 | ||||||||||
| CLM-CRUJRA | [-] | 107. | 106. | 59.8 | 0.274 | 0.445 | 2.98 | 0.493 | 0.700 | 0.597 | ||
| CLM-GSWP3 | [-] | 88.2 | 87.6 | 59.8 | 0.216 | 0.445 | 1.76 | 0.557 | 0.772 | 0.664 | ||
| CLM-Princeton | [-] | 127. | 126. | 59.8 | 0.269 | 0.445 | 4.22 | 0.493 | 0.653 | 0.573 | ||
| ISBA-CTRIP-CRUJRA | [-] | 122. | 119. | 60.2 | 0.831 | 0.0123 | 3.69 | 0.465 | 0.759 | 0.612 | ||
| ISBA-CTRIP-GSWP3 | [-] | 113. | 110. | 60.2 | 0.775 | 0.0123 | 3.12 | 0.507 | 0.804 | 0.656 | ||
| ISBA-CTRIP-Princeton | [-] | 158. | 155. | 60.2 | 1.12 | 0.0123 | 5.94 | 0.386 | 0.652 | 0.519 | ||
| JSBACH-CRUJRA | [-] | 40.5 | 39.2 | 55.7 | 0.0758 | 4.48 | -1.18 | 0.520 | 0.763 | 0.642 | ||
| JSBACH-GSWP3 | [-] | 63.5 | 61.9 | 55.7 | 0.137 | 4.48 | 0.448 | 0.610 | 0.848 | 0.729 | ||
| JSBACH-Princeton | [-] | 77.5 | 75.1 | 55.7 | 0.123 | 4.48 | 1.39 | 0.545 | 0.798 | 0.671 | ||
| Mean-CRUJRA | [-] | 95.8 | 95.4 | 60.1 | 0.591 | 0.0858 | 2.23 | 0.555 | 0.843 | 0.699 | ||
| Mean-GSWP3 | [-] | 93.7 | 93.0 | 60.1 | 0.564 | 0.0858 | 2.07 | 0.594 | 0.874 | 0.734 | ||
| Mean-Princeton | [-] | 128. | 127. | 60.1 | 0.766 | 0.0858 | 4.22 | 0.489 | 0.808 | 0.649 |
Download Data |
Period Mean (original grids) [Pg] |
Model Period Mean (intersection) [Pg] |
Benchmark Period Mean (intersection) [Pg] |
Model Period Mean (complement) [Pg] |
Benchmark Period Mean (complement) [Pg] |
Bias [kg m-2] |
Bias Score [1] |
Spatial Distribution Score [1] |
Overall Score [1] |
|||
|---|---|---|---|---|---|---|---|---|---|---|---|---|
| Benchmark | [-] | 50.9 | ||||||||||
| CLM-CRUJRA | [-] | 98.7 | 97.8 | 49.8 | 1.07 | 10.2 | 0.480 | 0.910 | 0.695 | |||
| CLM-GSWP3 | [-] | 84.6 | 84.1 | 49.8 | 1.07 | 7.24 | 0.587 | 0.955 | 0.771 | |||
| CLM-Princeton | [-] | 103. | 102. | 49.8 | 1.07 | 11.1 | 0.445 | 0.886 | 0.665 | |||
| ISBA-CTRIP-CRUJRA | [-] | 90.1 | 89.1 | 50.8 | 0.0545 | 7.65 | 0.582 | 0.942 | 0.762 | |||
| ISBA-CTRIP-GSWP3 | [-] | 80.1 | 79.4 | 50.8 | 0.0545 | 5.73 | 0.663 | 0.947 | 0.805 | |||
| ISBA-CTRIP-Princeton | [-] | 88.4 | 87.4 | 50.8 | 0.0545 | 7.32 | 0.599 | 0.940 | 0.770 | |||
| JSBACH-CRUJRA | [-] | 60.2 | 57.2 | 43.0 | 7.91 | 3.69 | 0.668 | 0.916 | 0.792 | |||
| JSBACH-GSWP3 | [-] | 47.1 | 44.9 | 43.0 | 7.91 | 0.508 | 0.778 | 0.963 | 0.871 | |||
| JSBACH-Princeton | [-] | 55.2 | 52.5 | 43.0 | 7.91 | 2.47 | 0.716 | 0.949 | 0.833 | |||
| Mean-CRUJRA | [-] | 88.2 | 90.8 | 50.8 | 0.0566 | 7.93 | 0.576 | 0.949 | 0.763 | |||
| Mean-GSWP3 | [-] | 76.2 | 78.2 | 50.8 | 0.0566 | 5.44 | 0.681 | 0.952 | 0.816 | |||
| Mean-Princeton | [-] | 88.5 | 90.9 | 50.8 | 0.0566 | 7.95 | 0.579 | 0.945 | 0.762 |
Download Data |
Period Mean (original grids) [Pg] |
Model Period Mean (intersection) [Pg] |
Benchmark Period Mean (intersection) [Pg] |
Model Period Mean (complement) [Pg] |
Benchmark Period Mean (complement) [Pg] |
Bias [kg m-2] |
Bias Score [1] |
Spatial Distribution Score [1] |
Overall Score [1] |
|||
|---|---|---|---|---|---|---|---|---|---|---|---|---|
| Benchmark | [-] | 156. | ||||||||||
| CLM-CRUJRA | [-] | 295. | 292. | 153. | 0.301 | 2.33 | 3.92 | 0.520 | 0.766 | 0.643 | ||
| CLM-GSWP3 | [-] | 220. | 217. | 153. | 0.255 | 2.33 | 1.79 | 0.627 | 0.864 | 0.746 | ||
| CLM-Princeton | [-] | 305. | 302. | 153. | 0.329 | 2.33 | 4.21 | 0.492 | 0.734 | 0.613 | ||
| ISBA-CTRIP-CRUJRA | [-] | 330. | 332. | 156. | 1.12 | 0.251 | 4.87 | 0.546 | 0.821 | 0.683 | ||
| ISBA-CTRIP-GSWP3 | [-] | 285. | 287. | 156. | 0.948 | 0.251 | 3.62 | 0.621 | 0.873 | 0.747 | ||
| ISBA-CTRIP-Princeton | [-] | 357. | 359. | 156. | 1.16 | 0.251 | 5.61 | 0.517 | 0.798 | 0.657 | ||
| JSBACH-CRUJRA | [-] | 189. | 190. | 142. | 0.110 | 13.9 | 1.55 | 0.654 | 0.903 | 0.779 | ||
| JSBACH-GSWP3 | [-] | 176. | 177. | 142. | 0.0994 | 13.9 | 1.13 | 0.670 | 0.894 | 0.782 | ||
| JSBACH-Princeton | [-] | 207. | 209. | 142. | 0.123 | 13.9 | 2.18 | 0.658 | 0.902 | 0.780 | ||
| Mean-CRUJRA | [-] | 301. | 294. | 155. | 1.11 | 0.348 | 3.84 | 0.602 | 0.869 | 0.735 | ||
| Mean-GSWP3 | [-] | 254. | 248. | 155. | 0.946 | 0.348 | 2.56 | 0.680 | 0.914 | 0.797 | ||
| Mean-Princeton | [-] | 322. | 315. | 155. | 1.12 | 0.348 | 4.42 | 0.571 | 0.856 | 0.714 |
Download Data |
Period Mean (original grids) [Pg] |
Model Period Mean (intersection) [Pg] |
Benchmark Period Mean (intersection) [Pg] |
Model Period Mean (complement) [Pg] |
Benchmark Period Mean (complement) [Pg] |
Bias [kg m-2] |
Bias Score [1] |
Spatial Distribution Score [1] |
Overall Score [1] |
|||
|---|---|---|---|---|---|---|---|---|---|---|---|---|
| Benchmark | [-] | 22.0 | ||||||||||
| CLM-CRUJRA | [-] | 27.0 | 30.2 | 22.0 | 0.353 | 0.00951 | 0.708 | 0.657 | 0.918 | 0.788 | ||
| CLM-GSWP3 | [-] | 18.2 | 19.5 | 22.0 | 0.225 | 0.00951 | -0.197 | 0.549 | 0.777 | 0.663 | ||
| CLM-Princeton | [-] | 43.6 | 47.9 | 22.0 | 0.516 | 0.00951 | 2.20 | 0.522 | 0.836 | 0.679 | ||
| ISBA-CTRIP-CRUJRA | [-] | 15.6 | 15.9 | 22.0 | 0.0307 | 0.00142 | -0.496 | 0.634 | 0.810 | 0.722 | ||
| ISBA-CTRIP-GSWP3 | [-] | 13.9 | 14.2 | 22.0 | 0.0274 | 0.00142 | -0.641 | 0.627 | 0.722 | 0.674 | ||
| ISBA-CTRIP-Princeton | [-] | 21.1 | 21.6 | 22.0 | 0.0326 | 0.00142 | -0.0191 | 0.644 | 0.920 | 0.782 | ||
| JSBACH-CRUJRA | [-] | 7.90 | 7.93 | 21.8 | 0.0221 | 0.147 | -1.22 | 0.455 | 0.298 | 0.376 | ||
| JSBACH-GSWP3 | [-] | 12.1 | 12.1 | 21.8 | 0.0451 | 0.147 | -0.857 | 0.470 | 0.478 | 0.474 | ||
| JSBACH-Princeton | [-] | 19.2 | 18.8 | 21.8 | 0.0398 | 0.147 | -0.255 | 0.591 | 0.793 | 0.692 | ||
| Mean-CRUJRA | [-] | 17.6 | 18.3 | 22.0 | 0.156 | 4.20e-06 | -0.307 | 0.644 | 0.692 | 0.668 | ||
| Mean-GSWP3 | [-] | 14.9 | 15.5 | 22.0 | 0.118 | 4.20e-06 | -0.540 | 0.576 | 0.514 | 0.545 | ||
| Mean-Princeton | [-] | 29.0 | 29.9 | 22.0 | 0.227 | 4.20e-06 | 0.658 | 0.697 | 0.938 | 0.817 |
Download Data |
Period Mean (original grids) [Pg] |
Model Period Mean (intersection) [Pg] |
Benchmark Period Mean (intersection) [Pg] |
Model Period Mean (complement) [Pg] |
Benchmark Period Mean (complement) [Pg] |
Bias [kg m-2] |
Bias Score [1] |
Spatial Distribution Score [1] |
Overall Score [1] |
|||
|---|---|---|---|---|---|---|---|---|---|---|---|---|
| Benchmark | [-] | 22.0 | ||||||||||
| CLM-CRUJRA | [-] | 25.2 | 25.1 | 21.9 | 0.139 | 0.140 | 0.200 | 0.541 | 0.794 | 0.668 | ||
| CLM-GSWP3 | [-] | 23.5 | 23.0 | 21.9 | 0.135 | 0.140 | 0.0681 | 0.557 | 0.815 | 0.686 | ||
| CLM-Princeton | [-] | 34.3 | 33.8 | 21.9 | 0.148 | 0.140 | 0.710 | 0.561 | 0.765 | 0.663 | ||
| ISBA-CTRIP-CRUJRA | [-] | 43.1 | 43.0 | 22.0 | 0.204 | 0.00748 | 1.23 | 0.517 | 0.730 | 0.623 | ||
| ISBA-CTRIP-GSWP3 | [-] | 43.4 | 42.9 | 22.0 | 0.207 | 0.00748 | 1.22 | 0.526 | 0.744 | 0.635 | ||
| ISBA-CTRIP-Princeton | [-] | 57.6 | 57.0 | 22.0 | 0.244 | 0.00748 | 2.04 | 0.468 | 0.613 | 0.540 | ||
| JSBACH-CRUJRA | [-] | 11.7 | 11.2 | 20.5 | 0.0389 | 1.55 | -0.573 | 0.479 | 0.564 | 0.522 | ||
| JSBACH-GSWP3 | [-] | 27.8 | 26.6 | 20.5 | 0.103 | 1.55 | 0.397 | 0.532 | 0.779 | 0.656 | ||
| JSBACH-Princeton | [-] | 24.4 | 23.3 | 20.5 | 0.0777 | 1.55 | 0.191 | 0.532 | 0.777 | 0.655 | ||
| Mean-CRUJRA | [-] | 29.8 | 29.2 | 21.9 | 0.212 | 0.0925 | 0.425 | 0.580 | 0.813 | 0.696 | ||
| Mean-GSWP3 | [-] | 34.3 | 33.6 | 21.9 | 0.232 | 0.0925 | 0.683 | 0.598 | 0.835 | 0.716 | ||
| Mean-Princeton | [-] | 42.2 | 41.4 | 21.9 | 0.255 | 0.0925 | 1.14 | 0.560 | 0.801 | 0.680 |
Temporally integrated period mean click to collapse contents