Download Data |
Period Mean (original grids) [Pg] |
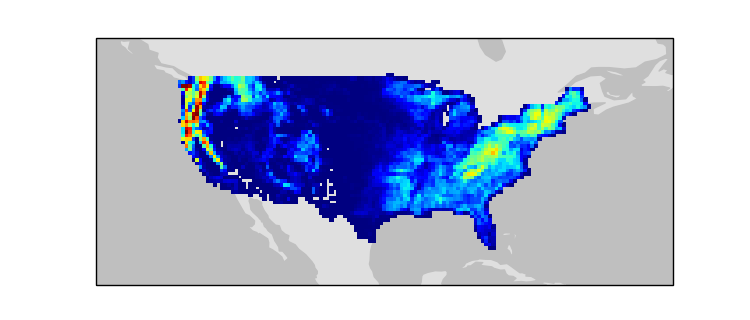
Model Period Mean (intersection) [Pg] |
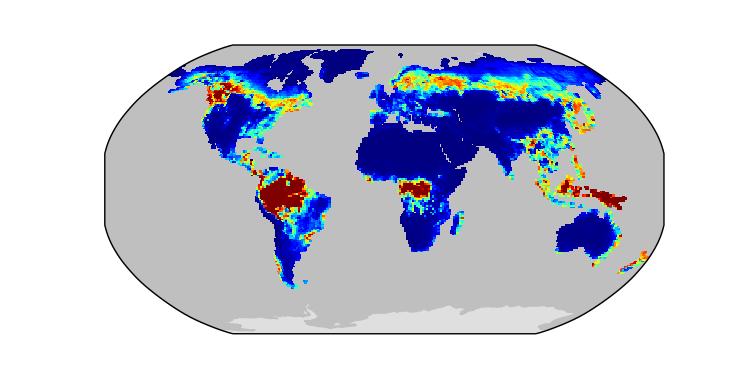
Benchmark Period Mean (intersection) [Pg] |
Model Period Mean (complement) [Pg] |
Benchmark Period Mean (complement) [Pg] |
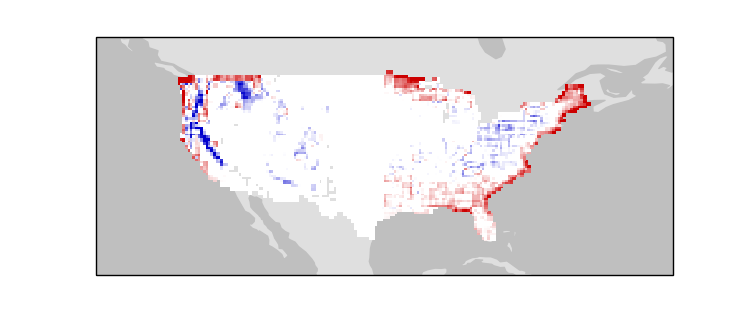
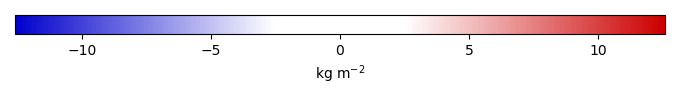
Bias [kg m-2] |
Bias Score [1] |
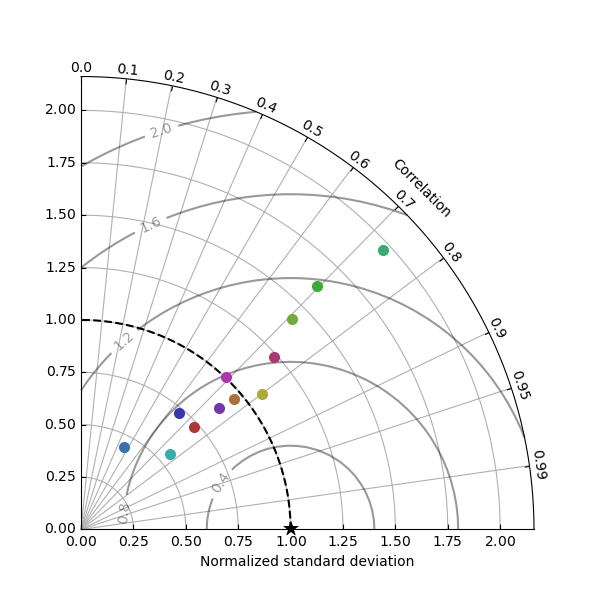
Spatial Distribution Score [1] |
Overall Score [1] |
|||
|---|---|---|---|---|---|---|---|---|---|---|---|---|
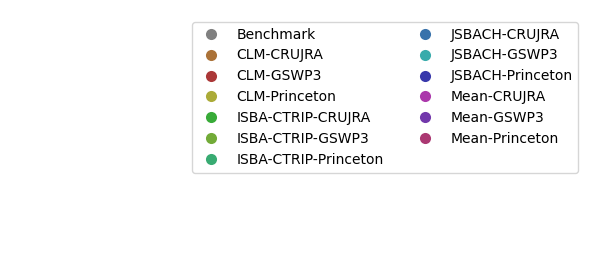
| Benchmark | [-] | 26.2 | ||||||||||
| CLM-CRUJRA | [-] | 721. | 24.6 | 26.1 | 691. | 0.0852 | -0.225 | 0.626 | 0.879 | 0.753 | ||
| CLM-GSWP3 | [-] | 577. | 17.5 | 26.1 | 553. | 0.0852 | -1.07 | 0.598 | 0.789 | 0.694 | ||
| CLM-Princeton | [-] | 812. | 29.4 | 26.1 | 779. | 0.0852 | 0.351 | 0.649 | 0.895 | 0.772 | ||
| ISBA-CTRIP-CRUJRA | [-] | 740. | 46.4 | 26.2 | 686. | 0.000922 | 2.46 | 0.550 | 0.678 | 0.614 | ||
| ISBA-CTRIP-GSWP3 | [-] | 663. | 42.8 | 26.2 | 614. | 0.000922 | 2.02 | 0.567 | 0.757 | 0.662 | ||
| ISBA-CTRIP-Princeton | [-] | 851. | 59.4 | 26.2 | 784. | 0.000922 | 4.05 | 0.472 | 0.566 | 0.519 | ||
| JSBACH-CRUJRA | [-] | 354. | 10.3 | 25.3 | 342. | 0.852 | -1.88 | 0.487 | 0.404 | 0.446 | ||
| JSBACH-GSWP3 | [-] | 387. | 24.8 | 25.3 | 361. | 0.852 | -0.0246 | 0.638 | 0.638 | 0.638 | ||
| JSBACH-Princeton | [-] | 453. | 19.6 | 25.3 | 432. | 0.852 | -0.696 | 0.567 | 0.744 | 0.656 | ||
| Mean-CRUJRA | [-] | 673. | 29.3 | 26.2 | 643. | 1.05e-05 | 0.381 | 0.592 | 0.845 | 0.719 | ||
| Mean-GSWP3 | [-] | 604. | 30.3 | 26.2 | 574. | 1.05e-05 | 0.501 | 0.645 | 0.860 | 0.752 | ||
| Mean-Princeton | [-] | 781. | 38.7 | 26.2 | 742. | 1.05e-05 | 1.52 | 0.603 | 0.834 | 0.719 |
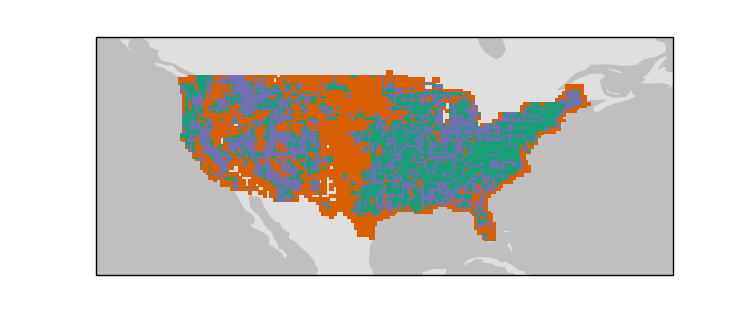
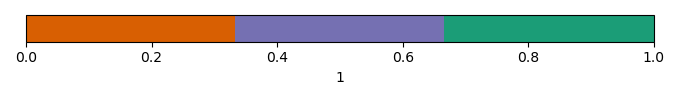
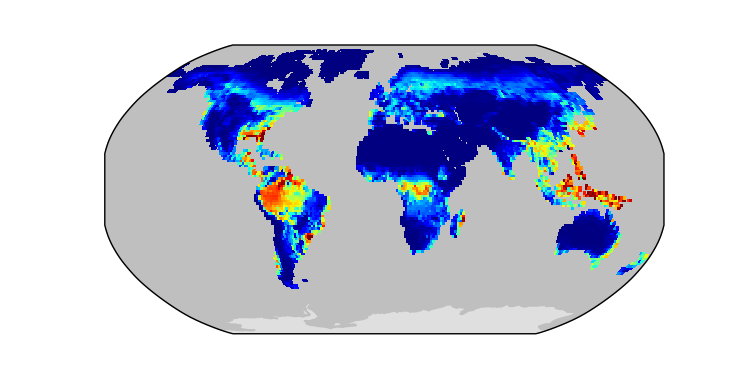
Temporally integrated period mean click to collapse contents