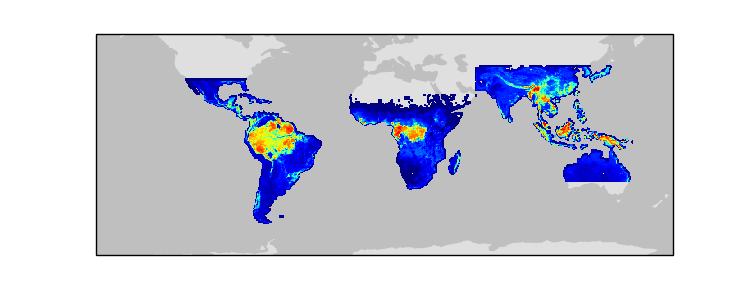
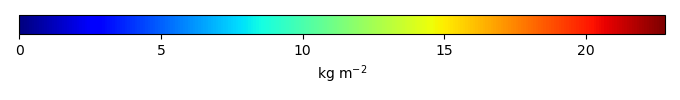
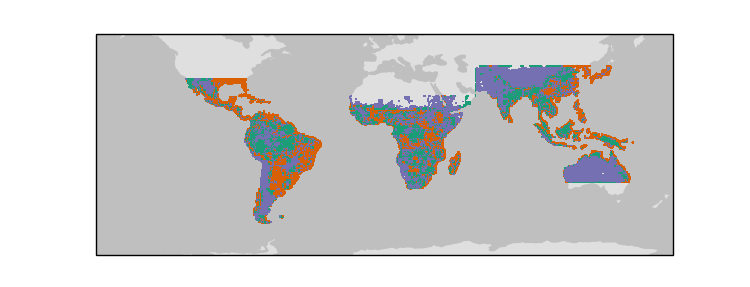
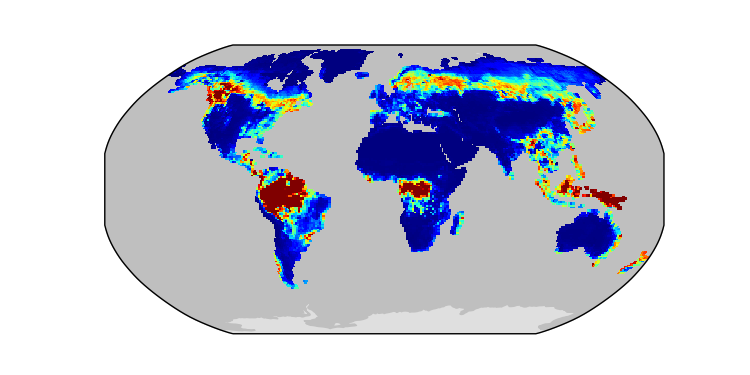
Biomass / Tropical / 1995-2006 / global / ISBA-CTRIP-Princeton
Global - Land
CLM-CRUJRA
Download Data |
Period Mean (original grids) [Pg] |
Model Period Mean (intersection) [Pg] |
Benchmark Period Mean (intersection) [Pg] |
Model Period Mean (complement) [Pg] |
Benchmark Period Mean (complement) [Pg] |
Bias [kg m-2] |
Bias Score [1] |
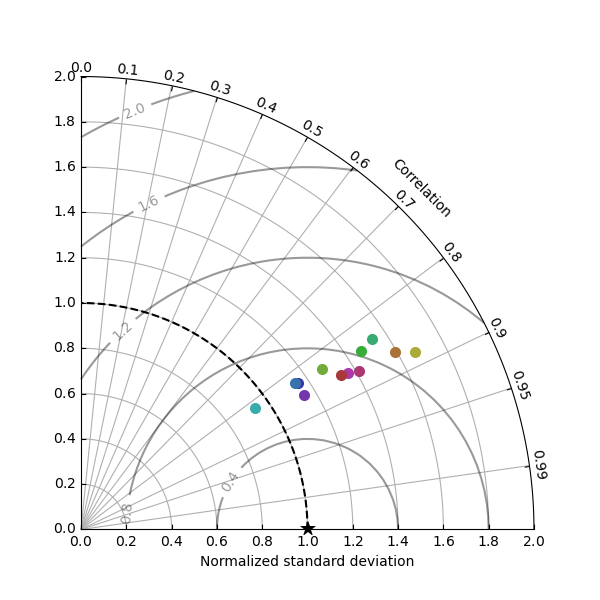
Spatial Distribution Score [1] |
Overall Score [1] |
|||
|---|---|---|---|---|---|---|---|---|---|---|---|---|
| Benchmark | [-] | 5.77 | ||||||||||
| CLM-CRUJRA | [-] | 108. | 0.586 | 5.77 | 107. | -3.89 | 0.401 | 0.666 | 0.533 | |||
| CLM-GSWP3 | [-] | 89.8 | 1.60 | 5.77 | 87.7 | -3.10 | 0.466 | 0.585 | 0.525 | |||
| CLM-Princeton | [-] | 139. | 2.61 | 5.77 | 135. | -2.35 | 0.532 | 0.510 | 0.521 | |||
| ISBA-CTRIP-CRUJRA | [-] | 56.7 | 0.599 | 5.77 | 56.8 | -3.75 | 0.408 | 0.582 | 0.495 | |||
| ISBA-CTRIP-GSWP3 | [-] | 50.8 | 0.759 | 5.77 | 50.7 | -3.60 | 0.409 | 0.468 | 0.438 | |||
| ISBA-CTRIP-Princeton | [-] | 76.6 | 0.915 | 5.77 | 76.7 | -3.46 | 0.415 | 0.386 | 0.401 | |||
| JSBACH-CRUJRA | [-] | 24.6 | 0.535 | 5.77 | 24.2 | -3.94 | 0.401 | 0.685 | 0.543 | |||
| JSBACH-GSWP3 | [-] | 36.9 | 1.21 | 5.77 | 35.5 | -3.42 | 0.438 | 0.633 | 0.536 | |||
| JSBACH-Princeton | [-] | 47.3 | 1.41 | 5.77 | 46.7 | -3.29 | 0.447 | 0.526 | 0.487 | |||
| Mean-CRUJRA | [-] | 62.2 | 0.565 | 5.77 | 63.4 | -3.91 | 0.404 | 0.651 | 0.527 | |||
| Mean-GSWP3 | [-] | 57.7 | 1.18 | 5.77 | 58.4 | -3.45 | 0.454 | 0.786 | 0.620 | |||
| Mean-Princeton | [-] | 86.0 | 1.58 | 5.77 | 87.0 | -3.15 | 0.483 | 0.735 | 0.609 |
Download Data |
Period Mean (original grids) [Pg] |
Model Period Mean (intersection) [Pg] |
Benchmark Period Mean (intersection) [Pg] |
Model Period Mean (complement) [Pg] |
Benchmark Period Mean (complement) [Pg] |
Bias [kg m-2] |
Bias Score [1] |
Spatial Distribution Score [1] |
Overall Score [1] |
|||
|---|---|---|---|---|---|---|---|---|---|---|---|---|
| Benchmark | [-] | 349. | ||||||||||
| CLM-CRUJRA | [-] | 720. | 441. | 347. | 274. | 2.11 | 1.31 | 0.579 | 0.758 | 0.669 | ||
| CLM-GSWP3 | [-] | 577. | 352. | 347. | 219. | 2.11 | 0.0359 | 0.639 | 0.856 | 0.747 | ||
| CLM-Princeton | [-] | 811. | 469. | 347. | 339. | 2.11 | 1.71 | 0.568 | 0.731 | 0.649 | ||
| ISBA-CTRIP-CRUJRA | [-] | 739. | 485. | 349. | 247. | 0.294 | 1.92 | 0.625 | 0.800 | 0.713 | ||
| ISBA-CTRIP-GSWP3 | [-] | 663. | 429. | 349. | 228. | 0.294 | 1.13 | 0.673 | 0.863 | 0.768 | ||
| ISBA-CTRIP-Princeton | [-] | 850. | 527. | 349. | 315. | 0.294 | 2.51 | 0.603 | 0.768 | 0.686 | ||
| JSBACH-CRUJRA | [-] | 354. | 288. | 319. | 64.4 | 30.2 | -0.488 | 0.633 | 0.896 | 0.765 | ||
| JSBACH-GSWP3 | [-] | 387. | 277. | 319. | 109. | 30.2 | -0.657 | 0.651 | 0.906 | 0.778 | ||
| JSBACH-Princeton | [-] | 452. | 320. | 319. | 130. | 30.2 | 0.0298 | 0.645 | 0.895 | 0.770 | ||
| Mean-CRUJRA | [-] | 672. | 435. | 349. | 237. | 0.334 | 1.21 | 0.652 | 0.846 | 0.749 | ||
| Mean-GSWP3 | [-] | 604. | 380. | 349. | 224. | 0.334 | 0.443 | 0.699 | 0.910 | 0.805 | ||
| Mean-Princeton | [-] | 780. | 472. | 349. | 308. | 0.334 | 1.74 | 0.641 | 0.831 | 0.736 |
Download Data |
Period Mean (original grids) [Pg] |
Model Period Mean (intersection) [Pg] |
Benchmark Period Mean (intersection) [Pg] |
Model Period Mean (complement) [Pg] |
Benchmark Period Mean (complement) [Pg] |
Bias [kg m-2] |
Bias Score [1] |
Spatial Distribution Score [1] |
Overall Score [1] |
|||
|---|---|---|---|---|---|---|---|---|---|---|---|---|
| Benchmark | [-] | 20.1 | ||||||||||
| CLM-CRUJRA | [-] | 7.31 | 5.15 | 20.0 | 1.59 | 0.0870 | -0.923 | 0.452 | 0.345 | 0.398 | ||
| CLM-GSWP3 | [-] | 5.04 | 3.55 | 20.0 | 1.22 | 0.0870 | -1.02 | 0.423 | 0.197 | 0.310 | ||
| CLM-Princeton | [-] | 6.54 | 4.47 | 20.0 | 1.46 | 0.0870 | -0.965 | 0.441 | 0.373 | 0.407 | ||
| ISBA-CTRIP-CRUJRA | [-] | 9.97 | 7.33 | 20.1 | 2.48 | 0.0246 | -0.769 | 0.456 | 0.684 | 0.570 | ||
| ISBA-CTRIP-GSWP3 | [-] | 9.19 | 6.71 | 20.1 | 2.36 | 0.0246 | -0.807 | 0.456 | 0.680 | 0.568 | ||
| ISBA-CTRIP-Princeton | [-] | 11.9 | 8.80 | 20.1 | 2.84 | 0.0246 | -0.677 | 0.461 | 0.686 | 0.574 | ||
| JSBACH-CRUJRA | [-] | 9.90 | 9.10 | 19.4 | 0.782 | 0.702 | -0.678 | 0.532 | 0.698 | 0.615 | ||
| JSBACH-GSWP3 | [-] | 12.0 | 10.9 | 19.4 | 1.20 | 0.702 | -0.557 | 0.569 | 0.806 | 0.688 | ||
| JSBACH-Princeton | [-] | 8.94 | 8.25 | 19.4 | 0.555 | 0.702 | -0.735 | 0.508 | 0.699 | 0.603 | ||
| Mean-CRUJRA | [-] | 10.5 | 7.84 | 20.1 | 2.45 | 0.0132 | -0.755 | 0.489 | 0.683 | 0.586 | ||
| Mean-GSWP3 | [-] | 10.1 | 7.63 | 20.1 | 2.24 | 0.0132 | -0.768 | 0.502 | 0.638 | 0.570 | ||
| Mean-Princeton | [-] | 10.9 | 7.95 | 20.1 | 2.62 | 0.0132 | -0.748 | 0.486 | 0.701 | 0.593 |
Download Data |
Period Mean (original grids) [Pg] |
Model Period Mean (intersection) [Pg] |
Benchmark Period Mean (intersection) [Pg] |
Model Period Mean (complement) [Pg] |
Benchmark Period Mean (complement) [Pg] |
Bias [kg m-2] |
Bias Score [1] |
Spatial Distribution Score [1] |
Overall Score [1] |
|||
|---|---|---|---|---|---|---|---|---|---|---|---|---|
| Benchmark | [-] | 5.36 | ||||||||||
| CLM-CRUJRA | [-] | 2.73 | 0.963 | 5.36 | 1.78 | 0.00265 | -1.74 | 0.434 | 0.364 | 0.399 | ||
| CLM-GSWP3 | [-] | 2.46 | 0.974 | 5.36 | 1.42 | 0.00265 | -1.73 | 0.432 | 0.491 | 0.461 | ||
| CLM-Princeton | [-] | 3.00 | 1.05 | 5.36 | 2.02 | 0.00265 | -1.71 | 0.441 | 0.451 | 0.446 | ||
| ISBA-CTRIP-CRUJRA | [-] | 2.95 | 0.475 | 5.36 | 1.94 | 0.000270 | -1.93 | 0.389 | 0.354 | 0.372 | ||
| ISBA-CTRIP-GSWP3 | [-] | 3.18 | 0.649 | 5.36 | 1.91 | 0.000270 | -1.86 | 0.393 | 0.492 | 0.442 | ||
| ISBA-CTRIP-Princeton | [-] | 3.56 | 0.628 | 5.36 | 2.28 | 0.000270 | -1.87 | 0.394 | 0.463 | 0.429 | ||
| JSBACH-CRUJRA | [-] | 0.916 | 0.346 | 5.33 | 0.589 | 0.0353 | -1.99 | 0.391 | 0.0972 | 0.244 | ||
| JSBACH-GSWP3 | [-] | 3.64 | 1.16 | 5.33 | 2.41 | 0.0353 | -1.67 | 0.427 | 0.433 | 0.430 | ||
| JSBACH-Princeton | [-] | 1.91 | 0.557 | 5.33 | 1.38 | 0.0353 | -1.90 | 0.405 | 0.214 | 0.309 | ||
| Mean-CRUJRA | [-] | 1.95 | 0.562 | 5.36 | 1.55 | 0.000270 | -1.87 | 0.403 | 0.148 | 0.275 | ||
| Mean-GSWP3 | [-] | 2.89 | 0.887 | 5.36 | 2.02 | 0.000270 | -1.74 | 0.425 | 0.327 | 0.376 | ||
| Mean-Princeton | [-] | 2.72 | 0.717 | 5.36 | 2.05 | 0.000270 | -1.81 | 0.412 | 0.261 | 0.337 |
Download Data |
Period Mean (original grids) [Pg] |
Model Period Mean (intersection) [Pg] |
Benchmark Period Mean (intersection) [Pg] |
Model Period Mean (complement) [Pg] |
Benchmark Period Mean (complement) [Pg] |
Bias [kg m-2] |
Bias Score [1] |
Spatial Distribution Score [1] |
Overall Score [1] |
|||
|---|---|---|---|---|---|---|---|---|---|---|---|---|
| Benchmark | [-] | 2.08 | ||||||||||
| CLM-CRUJRA | [-] | 7.61 | 2.69 | 2.05 | 4.41 | 0.0228 | 2.21 | 0.608 | 0.888 | 0.748 | ||
| CLM-GSWP3 | [-] | 7.08 | 2.69 | 2.05 | 3.87 | 0.0228 | 2.40 | 0.622 | 0.879 | 0.750 | ||
| CLM-Princeton | [-] | 8.84 | 3.24 | 2.05 | 4.97 | 0.0228 | 4.50 | 0.587 | 0.909 | 0.748 | ||
| ISBA-CTRIP-CRUJRA | [-] | 5.31 | 2.99 | 2.08 | 1.85 | 4.08 | 0.666 | 0.828 | 0.747 | |||
| ISBA-CTRIP-GSWP3 | [-] | 5.29 | 2.86 | 2.08 | 1.75 | 3.55 | 0.696 | 0.871 | 0.784 | |||
| ISBA-CTRIP-Princeton | [-] | 6.66 | 3.37 | 2.08 | 2.41 | 5.38 | 0.698 | 0.831 | 0.765 | |||
| JSBACH-CRUJRA | [-] | 3.10 | 1.46 | 1.80 | 1.55 | 0.281 | -1.50 | 0.568 | 0.704 | 0.636 | ||
| JSBACH-GSWP3 | [-] | 2.72 | 1.29 | 1.80 | 1.37 | 0.281 | -2.36 | 0.564 | 0.539 | 0.552 | ||
| JSBACH-Princeton | [-] | 4.49 | 1.70 | 1.80 | 2.06 | 0.281 | -0.508 | 0.606 | 0.695 | 0.651 | ||
| Mean-CRUJRA | [-] | 6.90 | 2.71 | 2.08 | 2.99 | 2.30 | 0.620 | 0.837 | 0.729 | |||
| Mean-GSWP3 | [-] | 6.46 | 2.62 | 2.08 | 2.71 | 1.97 | 0.638 | 0.798 | 0.718 | |||
| Mean-Princeton | [-] | 8.27 | 3.20 | 2.08 | 3.63 | 4.08 | 0.651 | 0.869 | 0.760 |
Download Data |
Period Mean (original grids) [Pg] |
Model Period Mean (intersection) [Pg] |
Benchmark Period Mean (intersection) [Pg] |
Model Period Mean (complement) [Pg] |
Benchmark Period Mean (complement) [Pg] |
Bias [kg m-2] |
Bias Score [1] |
Spatial Distribution Score [1] |
Overall Score [1] |
|||
|---|---|---|---|---|---|---|---|---|---|---|---|---|
| Benchmark | [-] | 25.4 | ||||||||||
| CLM-CRUJRA | [-] | 106. | 28.8 | 25.2 | 77.7 | 0.196 | 0.883 | 0.588 | 0.774 | 0.681 | ||
| CLM-GSWP3 | [-] | 88.1 | 27.4 | 25.2 | 60.3 | 0.196 | 0.487 | 0.639 | 0.848 | 0.744 | ||
| CLM-Princeton | [-] | 127. | 36.8 | 25.2 | 89.2 | 0.196 | 2.75 | 0.623 | 0.817 | 0.720 | ||
| ISBA-CTRIP-CRUJRA | [-] | 121. | 42.2 | 25.4 | 77.0 | 0.00194 | 3.98 | 0.547 | 0.708 | 0.627 | ||
| ISBA-CTRIP-GSWP3 | [-] | 112. | 39.8 | 25.4 | 70.6 | 0.00194 | 3.38 | 0.606 | 0.786 | 0.696 | ||
| ISBA-CTRIP-Princeton | [-] | 158. | 52.2 | 25.4 | 103. | 0.00194 | 6.28 | 0.490 | 0.618 | 0.554 | ||
| JSBACH-CRUJRA | [-] | 40.4 | 21.1 | 23.3 | 18.1 | 2.07 | -0.604 | 0.593 | 0.847 | 0.720 | ||
| JSBACH-GSWP3 | [-] | 63.5 | 26.4 | 23.3 | 35.6 | 2.07 | 0.824 | 0.601 | 0.861 | 0.731 | ||
| JSBACH-Princeton | [-] | 77.4 | 33.6 | 23.3 | 41.5 | 2.07 | 2.73 | 0.565 | 0.852 | 0.709 | ||
| Mean-CRUJRA | [-] | 95.6 | 33.9 | 25.4 | 61.9 | 1.98 | 0.605 | 0.843 | 0.724 | |||
| Mean-GSWP3 | [-] | 93.5 | 33.9 | 25.4 | 59.5 | 1.99 | 0.651 | 0.900 | 0.775 | |||
| Mean-Princeton | [-] | 128. | 44.4 | 25.4 | 83.1 | 4.44 | 0.568 | 0.846 | 0.707 |
Download Data |
Period Mean (original grids) [Pg] |
Model Period Mean (intersection) [Pg] |
Benchmark Period Mean (intersection) [Pg] |
Model Period Mean (complement) [Pg] |
Benchmark Period Mean (complement) [Pg] |
Bias [kg m-2] |
Bias Score [1] |
Spatial Distribution Score [1] |
Overall Score [1] |
|||
|---|---|---|---|---|---|---|---|---|---|---|---|---|
| Benchmark | [-] | 60.5 | ||||||||||
| CLM-CRUJRA | [-] | 98.6 | 97.6 | 59.9 | 0.0685 | 0.683 | 8.01 | 0.588 | 0.891 | 0.740 | ||
| CLM-GSWP3 | [-] | 84.5 | 83.9 | 59.9 | 0.0701 | 0.683 | 5.09 | 0.681 | 0.945 | 0.813 | ||
| CLM-Princeton | [-] | 103. | 102. | 59.9 | 0.0730 | 0.683 | 8.97 | 0.553 | 0.865 | 0.709 | ||
| ISBA-CTRIP-CRUJRA | [-] | 90.0 | 86.5 | 60.5 | 2.55 | 0.0633 | 5.31 | 0.674 | 0.946 | 0.810 | ||
| ISBA-CTRIP-GSWP3 | [-] | 80.1 | 76.9 | 60.5 | 2.46 | 0.0633 | 3.36 | 0.743 | 0.955 | 0.849 | ||
| ISBA-CTRIP-Princeton | [-] | 88.3 | 84.6 | 60.5 | 2.70 | 0.0633 | 4.94 | 0.688 | 0.947 | 0.818 | ||
| JSBACH-CRUJRA | [-] | 60.1 | 57.1 | 51.0 | 0.0129 | 9.59 | 1.63 | 0.714 | 0.876 | 0.795 | ||
| JSBACH-GSWP3 | [-] | 47.1 | 44.9 | 51.0 | 0.0117 | 9.59 | -1.55 | 0.780 | 0.958 | 0.869 | ||
| JSBACH-Princeton | [-] | 55.1 | 52.4 | 51.0 | 0.0142 | 9.59 | 0.412 | 0.750 | 0.922 | 0.836 | ||
| Mean-CRUJRA | [-] | 88.1 | 88.2 | 60.5 | 2.52 | 0.0267 | 5.61 | 0.669 | 0.949 | 0.809 | ||
| Mean-GSWP3 | [-] | 76.1 | 75.7 | 60.5 | 2.44 | 0.0267 | 3.08 | 0.756 | 0.959 | 0.857 | ||
| Mean-Princeton | [-] | 88.4 | 88.1 | 60.5 | 2.70 | 0.0267 | 5.60 | 0.670 | 0.948 | 0.809 |
Download Data |
Period Mean (original grids) [Pg] |
Model Period Mean (intersection) [Pg] |
Benchmark Period Mean (intersection) [Pg] |
Model Period Mean (complement) [Pg] |
Benchmark Period Mean (complement) [Pg] |
Bias [kg m-2] |
Bias Score [1] |
Spatial Distribution Score [1] |
Overall Score [1] |
|||
|---|---|---|---|---|---|---|---|---|---|---|---|---|
| Benchmark | [-] | 214. | ||||||||||
| CLM-CRUJRA | [-] | 295. | 291. | 212. | 1.54 | 2.57 | 2.23 | 0.601 | 0.795 | 0.698 | ||
| CLM-GSWP3 | [-] | 219. | 216. | 212. | 1.39 | 2.57 | 0.0890 | 0.665 | 0.885 | 0.775 | ||
| CLM-Princeton | [-] | 305. | 301. | 212. | 1.70 | 2.57 | 2.52 | 0.582 | 0.763 | 0.672 | ||
| ISBA-CTRIP-CRUJRA | [-] | 330. | 328. | 214. | 4.45 | 0.292 | 3.19 | 0.652 | 0.865 | 0.759 | ||
| ISBA-CTRIP-GSWP3 | [-] | 285. | 284. | 214. | 4.10 | 0.292 | 1.93 | 0.703 | 0.909 | 0.806 | ||
| ISBA-CTRIP-Princeton | [-] | 357. | 355. | 214. | 4.86 | 0.292 | 3.93 | 0.621 | 0.844 | 0.732 | ||
| JSBACH-CRUJRA | [-] | 188. | 190. | 195. | 0.244 | 19.3 | -0.165 | 0.652 | 0.911 | 0.782 | ||
| JSBACH-GSWP3 | [-] | 176. | 176. | 195. | 0.236 | 19.3 | -0.588 | 0.656 | 0.893 | 0.775 | ||
| JSBACH-Princeton | [-] | 207. | 209. | 195. | 0.285 | 19.3 | 0.462 | 0.665 | 0.915 | 0.790 | ||
| Mean-CRUJRA | [-] | 301. | 291. | 214. | 4.12 | 0.408 | 2.15 | 0.683 | 0.898 | 0.791 | ||
| Mean-GSWP3 | [-] | 253. | 245. | 214. | 3.80 | 0.408 | 0.863 | 0.726 | 0.933 | 0.830 | ||
| Mean-Princeton | [-] | 322. | 312. | 214. | 4.47 | 0.408 | 2.73 | 0.667 | 0.888 | 0.778 |
Download Data |
Period Mean (original grids) [Pg] |
Model Period Mean (intersection) [Pg] |
Benchmark Period Mean (intersection) [Pg] |
Model Period Mean (complement) [Pg] |
Benchmark Period Mean (complement) [Pg] |
Bias [kg m-2] |
Bias Score [1] |
Spatial Distribution Score [1] |
Overall Score [1] |
|||
|---|---|---|---|---|---|---|---|---|---|---|---|---|
| Benchmark | [-] | 0.801 | ||||||||||
| CLM-CRUJRA | [-] | 26.9 | 0.0204 | 0.801 | 30.4 | -3.82 | 0.379 | 0.170 | 0.274 | |||
| CLM-GSWP3 | [-] | 18.1 | 0.108 | 0.801 | 19.6 | -3.39 | 0.417 | 0.763 | 0.590 | |||
| CLM-Princeton | [-] | 43.5 | 0.124 | 0.801 | 48.2 | -3.30 | 0.427 | 0.790 | 0.608 | |||
| ISBA-CTRIP-CRUJRA | [-] | 15.5 | 0.0103 | 0.801 | 15.9 | -3.83 | 0.373 | 0.577 | 0.475 | |||
| ISBA-CTRIP-GSWP3 | [-] | 13.9 | 0.0147 | 0.801 | 14.2 | -3.79 | 0.374 | 0.557 | 0.465 | |||
| ISBA-CTRIP-Princeton | [-] | 21.1 | 0.0149 | 0.801 | 21.6 | -3.79 | 0.374 | 0.538 | 0.456 | |||
| JSBACH-CRUJRA | [-] | 7.89 | 0.00290 | 0.801 | 7.94 | -3.96 | 0.369 | 0.0117 | 0.190 | |||
| JSBACH-GSWP3 | [-] | 12.1 | 0.0127 | 0.801 | 12.1 | -3.92 | 0.374 | 0.103 | 0.238 | |||
| JSBACH-Princeton | [-] | 19.2 | 0.00997 | 0.801 | 18.8 | -3.93 | 0.373 | 0.0778 | 0.225 | |||
| Mean-CRUJRA | [-] | 17.6 | 0.0111 | 0.801 | 18.4 | -3.89 | 0.373 | 0.0245 | 0.199 | |||
| Mean-GSWP3 | [-] | 14.8 | 0.0425 | 0.801 | 15.5 | -3.74 | 0.388 | 0.102 | 0.245 | |||
| Mean-Princeton | [-] | 28.9 | 0.0490 | 0.801 | 30.0 | -3.70 | 0.391 | 0.137 | 0.264 |
Download Data |
Period Mean (original grids) [Pg] |
Model Period Mean (intersection) [Pg] |
Benchmark Period Mean (intersection) [Pg] |
Model Period Mean (complement) [Pg] |
Benchmark Period Mean (complement) [Pg] |
Bias [kg m-2] |
Bias Score [1] |
Spatial Distribution Score [1] |
Overall Score [1] |
|||
|---|---|---|---|---|---|---|---|---|---|---|---|---|
| Benchmark | [-] | 16.7 | ||||||||||
| CLM-CRUJRA | [-] | 25.2 | 9.16 | 16.7 | 16.0 | 0.0266 | -1.38 | 0.530 | 0.786 | 0.658 | ||
| CLM-GSWP3 | [-] | 23.5 | 10.4 | 16.7 | 12.7 | 0.0266 | -1.17 | 0.545 | 0.763 | 0.654 | ||
| CLM-Princeton | [-] | 34.2 | 12.6 | 16.7 | 21.3 | 0.0266 | -0.758 | 0.561 | 0.718 | 0.639 | ||
| ISBA-CTRIP-CRUJRA | [-] | 42.9 | 17.6 | 16.7 | 25.4 | 0.000419 | 0.156 | 0.536 | 0.632 | 0.584 | ||
| ISBA-CTRIP-GSWP3 | [-] | 43.3 | 18.3 | 16.7 | 24.6 | 0.000419 | 0.281 | 0.546 | 0.638 | 0.592 | ||
| ISBA-CTRIP-Princeton | [-] | 57.4 | 22.9 | 16.7 | 34.2 | 0.000419 | 1.12 | 0.491 | 0.497 | 0.494 | ||
| JSBACH-CRUJRA | [-] | 11.7 | 6.74 | 16.3 | 4.48 | 0.353 | -1.83 | 0.513 | 0.807 | 0.660 | ||
| JSBACH-GSWP3 | [-] | 27.8 | 12.8 | 16.3 | 13.8 | 0.353 | -0.676 | 0.518 | 0.755 | 0.636 | ||
| JSBACH-Princeton | [-] | 24.3 | 11.9 | 16.3 | 11.4 | 0.353 | -0.847 | 0.536 | 0.727 | 0.632 | ||
| Mean-CRUJRA | [-] | 29.7 | 11.6 | 16.7 | 17.7 | -0.931 | 0.588 | 0.846 | 0.717 | |||
| Mean-GSWP3 | [-] | 34.2 | 14.4 | 16.7 | 19.3 | -0.426 | 0.595 | 0.823 | 0.709 | |||
| Mean-Princeton | [-] | 42.1 | 16.4 | 16.7 | 25.1 | -0.0484 | 0.588 | 0.735 | 0.662 |
Temporally integrated period mean click to collapse contents