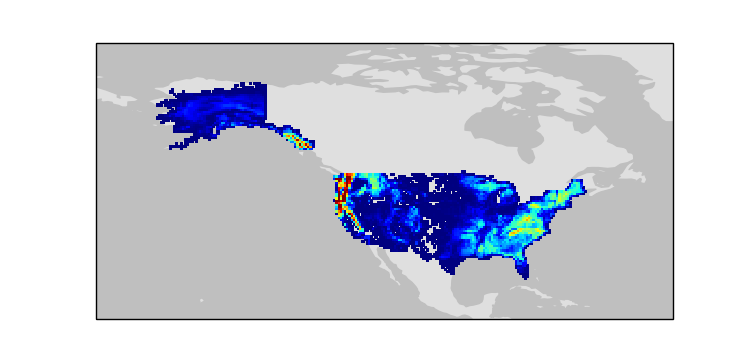
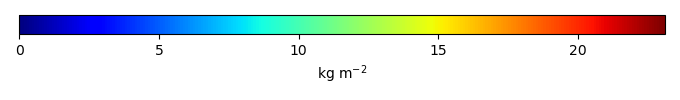
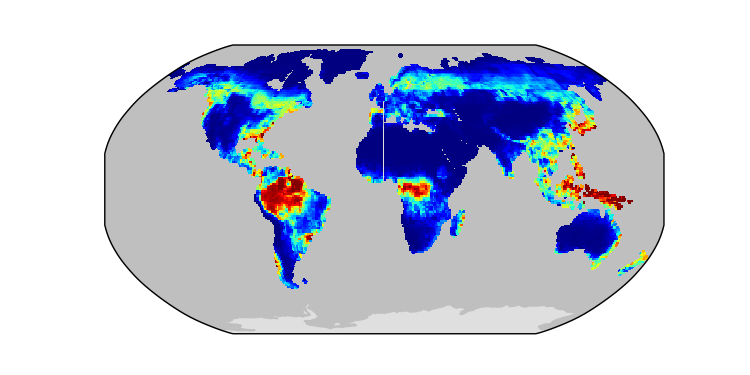
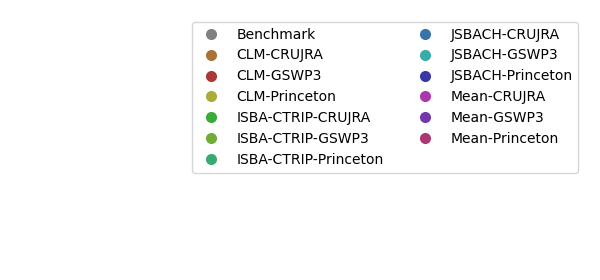
Biomass / USForest / 1996-2006 / global / Mean-Princeton
Global - Land
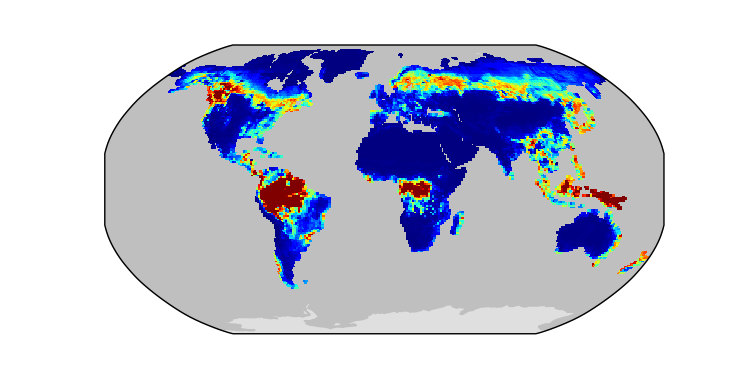
CLM-CRUJRA
Download Data |
Period Mean (original grids) [Pg] |
Model Period Mean (intersection) [Pg] |
Benchmark Period Mean (intersection) [Pg] |
Model Period Mean (complement) [Pg] |
Benchmark Period Mean (complement) [Pg] |
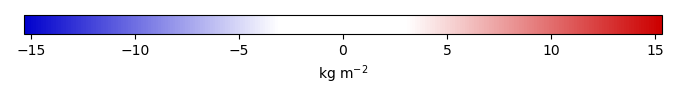
Bias [kg m-2] |
Bias Score [1] |
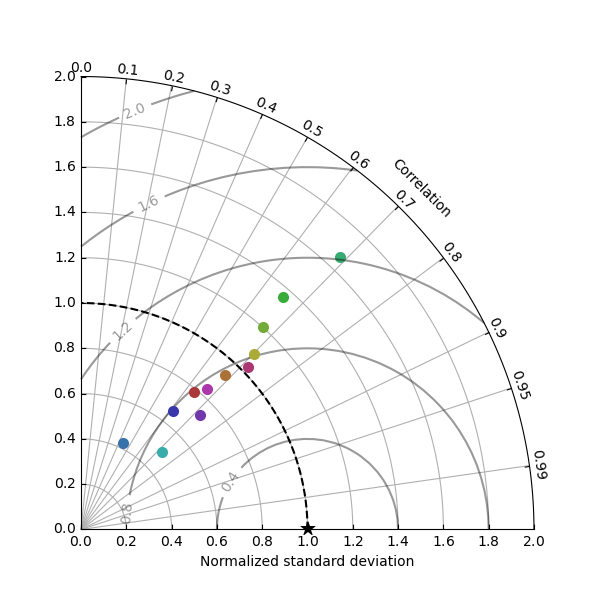
Spatial Distribution Score [1] |
Overall Score [1] |
|||
|---|---|---|---|---|---|---|---|---|---|---|---|---|
| Benchmark | [-] | 1.62 | ||||||||||
| CLM-CRUJRA | [-] | 109. | 5.63 | 1.62 | 102. | 0.00637 | 4.25 | 0.290 | 0.628 | 0.459 | ||
| CLM-GSWP3 | [-] | 89.9 | 5.38 | 1.62 | 84.0 | 0.00637 | 3.96 | 0.298 | 0.661 | 0.480 | ||
| CLM-Princeton | [-] | 139. | 7.53 | 1.62 | 131. | 0.00637 | 6.19 | 0.250 | 0.435 | 0.343 | ||
| ISBA-CTRIP-CRUJRA | [-] | 56.8 | 1.45 | 1.62 | 56.0 | -0.177 | 0.586 | 0.703 | 0.645 | |||
| ISBA-CTRIP-GSWP3 | [-] | 50.9 | 1.32 | 1.62 | 50.2 | -0.306 | 0.590 | 0.638 | 0.614 | |||
| ISBA-CTRIP-Princeton | [-] | 76.7 | 1.92 | 1.62 | 75.8 | 0.315 | 0.574 | 0.824 | 0.699 | |||
| JSBACH-CRUJRA | [-] | 24.6 | 2.21 | 1.61 | 22.6 | 0.0130 | 0.681 | 0.547 | 0.716 | 0.632 | ||
| JSBACH-GSWP3 | [-] | 37.0 | 2.99 | 1.61 | 33.8 | 0.0130 | 1.51 | 0.537 | 0.771 | 0.654 | ||
| JSBACH-Princeton | [-] | 47.4 | 3.31 | 1.61 | 44.8 | 0.0130 | 1.86 | 0.494 | 0.762 | 0.628 | ||
| Mean-CRUJRA | [-] | 62.3 | 3.19 | 1.62 | 60.9 | 1.65 | 0.497 | 0.804 | 0.650 | |||
| Mean-GSWP3 | [-] | 57.8 | 3.32 | 1.62 | 56.4 | 1.78 | 0.483 | 0.821 | 0.652 | |||
| Mean-Princeton | [-] | 86.0 | 4.39 | 1.62 | 84.3 | 2.90 | 0.413 | 0.864 | 0.639 |
Download Data |
Period Mean (original grids) [Pg] |
Model Period Mean (intersection) [Pg] |
Benchmark Period Mean (intersection) [Pg] |
Model Period Mean (complement) [Pg] |
Benchmark Period Mean (complement) [Pg] |
Bias [kg m-2] |
Bias Score [1] |
Spatial Distribution Score [1] |
Overall Score [1] |
|||
|---|---|---|---|---|---|---|---|---|---|---|---|---|
| Benchmark | [-] | 30.1 | ||||||||||
| CLM-CRUJRA | [-] | 721. | 33.1 | 29.9 | 682. | 0.176 | 0.319 | 0.606 | 0.837 | 0.721 | ||
| CLM-GSWP3 | [-] | 577. | 25.7 | 29.9 | 545. | 0.176 | -0.479 | 0.574 | 0.772 | 0.673 | ||
| CLM-Princeton | [-] | 812. | 40.0 | 29.9 | 769. | 0.176 | 1.05 | 0.624 | 0.846 | 0.735 | ||
| ISBA-CTRIP-CRUJRA | [-] | 740. | 48.3 | 30.1 | 685. | 0.00580 | 1.96 | 0.536 | 0.755 | 0.645 | ||
| ISBA-CTRIP-GSWP3 | [-] | 663. | 44.5 | 30.1 | 613. | 0.00580 | 1.55 | 0.555 | 0.807 | 0.681 | ||
| ISBA-CTRIP-Princeton | [-] | 851. | 61.8 | 30.1 | 781. | 0.00580 | 3.44 | 0.476 | 0.660 | 0.568 | ||
| JSBACH-CRUJRA | [-] | 354. | 13.4 | 29.0 | 339. | 1.09 | -1.76 | 0.481 | 0.369 | 0.425 | ||
| JSBACH-GSWP3 | [-] | 387. | 28.3 | 29.0 | 358. | 1.09 | -0.0553 | 0.614 | 0.545 | 0.580 | ||
| JSBACH-Princeton | [-] | 453. | 24.0 | 29.0 | 427. | 1.09 | -0.546 | 0.562 | 0.685 | 0.623 | ||
| Mean-CRUJRA | [-] | 673. | 34.0 | 30.1 | 639. | 2.82e-05 | 0.419 | 0.586 | 0.806 | 0.696 | ||
| Mean-GSWP3 | [-] | 604. | 34.9 | 30.1 | 570. | 2.82e-05 | 0.516 | 0.630 | 0.781 | 0.705 | ||
| Mean-Princeton | [-] | 781. | 44.7 | 30.1 | 736. | 2.82e-05 | 1.58 | 0.587 | 0.858 | 0.723 |
Download Data |
Period Mean (original grids) [Pg] |
Model Period Mean (intersection) [Pg] |
Benchmark Period Mean (intersection) [Pg] |
Model Period Mean (complement) [Pg] |
Benchmark Period Mean (complement) [Pg] |
Bias [kg m-2] |
Bias Score [1] |
Spatial Distribution Score [1] |
Overall Score [1] |
|||
|---|---|---|---|---|---|---|---|---|---|---|---|---|
| Benchmark | [-] | 0.0236 | ||||||||||
| CLM-CRUJRA | [-] | 7.32 | 0.152 | 0.0236 | 6.60 | 0.342 | 0.442 | 0.388 | 0.415 | |||
| CLM-GSWP3 | [-] | 5.05 | 0.0956 | 0.0236 | 4.67 | 0.188 | 0.481 | 0.505 | 0.493 | |||
| CLM-Princeton | [-] | 6.55 | 0.121 | 0.0236 | 5.82 | 0.263 | 0.462 | 0.454 | 0.458 | |||
| ISBA-CTRIP-CRUJRA | [-] | 9.97 | 0.203 | 0.0236 | 9.61 | 0.490 | 0.462 | 0.177 | 0.319 | |||
| ISBA-CTRIP-GSWP3 | [-] | 9.20 | 0.206 | 0.0236 | 8.87 | 0.497 | 0.441 | 0.156 | 0.298 | |||
| ISBA-CTRIP-Princeton | [-] | 11.9 | 0.221 | 0.0236 | 11.4 | 0.542 | 0.425 | 0.143 | 0.284 | |||
| JSBACH-CRUJRA | [-] | 9.92 | 0.162 | 0.0232 | 9.74 | 0.000454 | 0.390 | 0.495 | 0.429 | 0.462 | ||
| JSBACH-GSWP3 | [-] | 12.1 | 0.341 | 0.0232 | 11.8 | 0.000454 | 0.893 | 0.363 | 0.231 | 0.297 | ||
| JSBACH-Princeton | [-] | 8.97 | 0.185 | 0.0232 | 8.65 | 0.000454 | 0.447 | 0.519 | 0.511 | 0.515 | ||
| Mean-CRUJRA | [-] | 10.5 | 0.183 | 0.0236 | 10.1 | 0.431 | 0.442 | 0.363 | 0.403 | |||
| Mean-GSWP3 | [-] | 10.2 | 0.218 | 0.0236 | 9.68 | 0.524 | 0.449 | 0.342 | 0.396 | |||
| Mean-Princeton | [-] | 10.9 | 0.188 | 0.0236 | 10.4 | 0.444 | 0.412 | 0.379 | 0.395 |
Download Data |
Period Mean (original grids) [Pg] |
Model Period Mean (intersection) [Pg] |
Benchmark Period Mean (intersection) [Pg] |
Model Period Mean (complement) [Pg] |
Benchmark Period Mean (complement) [Pg] |
Bias [kg m-2] |
Bias Score [1] |
Spatial Distribution Score [1] |
Overall Score [1] |
|||
|---|---|---|---|---|---|---|---|---|---|---|---|---|
| Benchmark | [-] | 0.897 | ||||||||||
| CLM-CRUJRA | [-] | 2.73 | 0.493 | 0.896 | 2.26 | 0.00112 | -0.372 | 0.457 | 0.426 | 0.442 | ||
| CLM-GSWP3 | [-] | 2.46 | 0.401 | 0.896 | 2.00 | 0.00112 | -0.457 | 0.457 | 0.242 | 0.349 | ||
| CLM-Princeton | [-] | 3.00 | 0.726 | 0.896 | 2.34 | 0.00112 | -0.125 | 0.483 | 0.525 | 0.504 | ||
| ISBA-CTRIP-CRUJRA | [-] | 2.96 | 0.610 | 0.897 | 1.81 | 3.16e-06 | -0.294 | 0.475 | 0.373 | 0.424 | ||
| ISBA-CTRIP-GSWP3 | [-] | 3.18 | 0.559 | 0.897 | 2.00 | 3.16e-06 | -0.339 | 0.469 | 0.267 | 0.368 | ||
| ISBA-CTRIP-Princeton | [-] | 3.56 | 0.755 | 0.897 | 2.16 | 3.16e-06 | -0.150 | 0.488 | 0.483 | 0.485 | ||
| JSBACH-CRUJRA | [-] | 0.919 | 0.227 | 0.873 | 0.709 | 0.0236 | -0.701 | 0.420 | 0.0345 | 0.227 | ||
| JSBACH-GSWP3 | [-] | 3.64 | 1.15 | 0.873 | 2.42 | 0.0236 | 0.218 | 0.501 | 0.188 | 0.345 | ||
| JSBACH-Princeton | [-] | 1.92 | 0.473 | 0.873 | 1.47 | 0.0236 | -0.456 | 0.447 | 0.114 | 0.281 | ||
| Mean-CRUJRA | [-] | 1.95 | 0.465 | 0.897 | 1.65 | -0.431 | 0.458 | 0.291 | 0.375 | |||
| Mean-GSWP3 | [-] | 2.89 | 0.708 | 0.897 | 2.20 | -0.188 | 0.498 | 0.186 | 0.342 | |||
| Mean-Princeton | [-] | 2.72 | 0.687 | 0.897 | 2.08 | -0.209 | 0.486 | 0.399 | 0.443 |
Download Data |
Period Mean (original grids) [Pg] |
Model Period Mean (intersection) [Pg] |
Benchmark Period Mean (intersection) [Pg] |
Model Period Mean (complement) [Pg] |
Benchmark Period Mean (complement) [Pg] |
Bias [kg m-2] |
Bias Score [1] |
Spatial Distribution Score [1] |
Overall Score [1] |
|||
|---|---|---|---|---|---|---|---|---|---|---|---|---|
| Benchmark | [-] | 0.914 | ||||||||||
| CLM-CRUJRA | [-] | 7.62 | 1.18 | 0.851 | 5.92 | 0.0639 | 3.44 | 0.660 | 0.915 | 0.788 | ||
| CLM-GSWP3 | [-] | 7.08 | 1.04 | 0.851 | 5.52 | 0.0639 | 1.69 | 0.669 | 0.883 | 0.776 | ||
| CLM-Princeton | [-] | 8.85 | 1.30 | 0.851 | 6.91 | 0.0639 | 4.91 | 0.660 | 0.919 | 0.790 | ||
| ISBA-CTRIP-CRUJRA | [-] | 5.32 | 0.355 | 0.913 | 4.49 | 0.00187 | -5.94 | 0.519 | 0.473 | 0.496 | ||
| ISBA-CTRIP-GSWP3 | [-] | 5.30 | 0.345 | 0.913 | 4.28 | 0.00187 | -6.10 | 0.513 | 0.412 | 0.462 | ||
| ISBA-CTRIP-Princeton | [-] | 6.67 | 0.462 | 0.913 | 5.33 | 0.00187 | -4.76 | 0.562 | 0.634 | 0.598 | ||
| JSBACH-CRUJRA | [-] | 3.11 | 0.406 | 0.771 | 2.61 | 0.143 | -4.81 | 0.559 | 0.595 | 0.577 | ||
| JSBACH-GSWP3 | [-] | 2.72 | 0.482 | 0.771 | 2.18 | 0.143 | -3.79 | 0.604 | 0.549 | 0.577 | ||
| JSBACH-Princeton | [-] | 4.49 | 0.707 | 0.771 | 3.05 | 0.143 | -0.862 | 0.659 | 0.606 | 0.633 | ||
| Mean-CRUJRA | [-] | 6.91 | 0.643 | 0.912 | 5.07 | 0.00233 | -2.87 | 0.645 | 0.688 | 0.666 | ||
| Mean-GSWP3 | [-] | 6.47 | 0.625 | 0.912 | 4.71 | 0.00233 | -3.05 | 0.650 | 0.572 | 0.611 | ||
| Mean-Princeton | [-] | 8.28 | 0.841 | 0.912 | 6.00 | 0.00233 | -0.762 | 0.719 | 0.700 | 0.709 |
Download Data |
Period Mean (original grids) [Pg] |
Model Period Mean (intersection) [Pg] |
Benchmark Period Mean (intersection) [Pg] |
Model Period Mean (complement) [Pg] |
Benchmark Period Mean (complement) [Pg] |
Bias [kg m-2] |
Bias Score [1] |
Spatial Distribution Score [1] |
Overall Score [1] |
|||
|---|---|---|---|---|---|---|---|---|---|---|---|---|
| Benchmark | [-] | 20.0 | ||||||||||
| CLM-CRUJRA | [-] | 107. | 19.4 | 19.9 | 87.2 | 0.104 | -0.203 | 0.667 | 0.856 | 0.761 | ||
| CLM-GSWP3 | [-] | 88.2 | 14.4 | 19.9 | 73.4 | 0.104 | -1.61 | 0.629 | 0.754 | 0.691 | ||
| CLM-Princeton | [-] | 127. | 22.2 | 19.9 | 104. | 0.104 | 0.558 | 0.679 | 0.901 | 0.790 | ||
| ISBA-CTRIP-CRUJRA | [-] | 122. | 30.5 | 20.0 | 89.0 | 0.00478 | 2.95 | 0.577 | 0.867 | 0.722 | ||
| ISBA-CTRIP-GSWP3 | [-] | 113. | 28.3 | 20.0 | 82.4 | 0.00478 | 2.35 | 0.595 | 0.874 | 0.735 | ||
| ISBA-CTRIP-Princeton | [-] | 158. | 40.5 | 20.0 | 115. | 0.00478 | 5.77 | 0.481 | 0.799 | 0.640 | ||
| JSBACH-CRUJRA | [-] | 40.5 | 6.11 | 19.4 | 33.2 | 0.634 | -3.94 | 0.474 | 0.309 | 0.391 | ||
| JSBACH-GSWP3 | [-] | 63.5 | 14.7 | 19.4 | 47.3 | 0.634 | -1.37 | 0.637 | 0.444 | 0.540 | ||
| JSBACH-Princeton | [-] | 77.5 | 13.3 | 19.4 | 62.0 | 0.634 | -1.77 | 0.590 | 0.643 | 0.617 | ||
| Mean-CRUJRA | [-] | 95.8 | 19.8 | 20.0 | 76.2 | 0.00116 | -0.0718 | 0.644 | 0.744 | 0.694 | ||
| Mean-GSWP3 | [-] | 93.7 | 20.2 | 20.0 | 73.3 | 0.00116 | 0.0479 | 0.677 | 0.712 | 0.694 | ||
| Mean-Princeton | [-] | 128. | 26.8 | 20.0 | 101. | 0.00116 | 1.88 | 0.639 | 0.870 | 0.755 |
Download Data |
Period Mean (original grids) [Pg] |
Model Period Mean (intersection) [Pg] |
Benchmark Period Mean (intersection) [Pg] |
Model Period Mean (complement) [Pg] |
Benchmark Period Mean (complement) [Pg] |
Bias [kg m-2] |
Bias Score [1] |
Spatial Distribution Score [1] |
Overall Score [1] |
|||
|---|---|---|---|---|---|---|---|---|---|---|---|---|
| Benchmark | [-] | 2.13 | ||||||||||
| CLM-CRUJRA | [-] | 295. | 3.46 | 2.12 | 289. | 0.00749 | 1.90 | 0.670 | 0.922 | 0.796 | ||
| CLM-GSWP3 | [-] | 220. | 1.50 | 2.12 | 216. | 0.00749 | -0.926 | 0.553 | 0.784 | 0.669 | ||
| CLM-Princeton | [-] | 305. | 3.51 | 2.12 | 299. | 0.00749 | 1.98 | 0.664 | 0.914 | 0.789 | ||
| ISBA-CTRIP-CRUJRA | [-] | 330. | 10.9 | 2.13 | 322. | 0.000207 | 12.2 | 0.131 | 0.343 | 0.237 | ||
| ISBA-CTRIP-GSWP3 | [-] | 285. | 9.27 | 2.13 | 279. | 0.000207 | 9.95 | 0.214 | 0.441 | 0.328 | ||
| ISBA-CTRIP-Princeton | [-] | 357. | 12.1 | 2.13 | 348. | 0.000207 | 13.9 | 0.0970 | 0.295 | 0.196 | ||
| JSBACH-CRUJRA | [-] | 189. | 2.36 | 1.91 | 188. | 0.215 | 0.986 | 0.674 | 0.831 | 0.752 | ||
| JSBACH-GSWP3 | [-] | 176. | 2.88 | 1.91 | 174. | 0.215 | 1.92 | 0.708 | 0.888 | 0.798 | ||
| JSBACH-Princeton | [-] | 207. | 3.35 | 1.91 | 206. | 0.215 | 2.74 | 0.642 | 0.885 | 0.763 | ||
| Mean-CRUJRA | [-] | 301. | 6.52 | 2.13 | 289. | 6.23 | 0.394 | 0.688 | 0.541 | |||
| Mean-GSWP3 | [-] | 254. | 5.26 | 2.13 | 244. | 4.44 | 0.576 | 0.801 | 0.688 | |||
| Mean-Princeton | [-] | 322. | 7.25 | 2.13 | 309. | 7.26 | 0.313 | 0.602 | 0.457 |
Download Data |
Period Mean (original grids) [Pg] |
Model Period Mean (intersection) [Pg] |
Benchmark Period Mean (intersection) [Pg] |
Model Period Mean (complement) [Pg] |
Benchmark Period Mean (complement) [Pg] |
Bias [kg m-2] |
Bias Score [1] |
Spatial Distribution Score [1] |
Overall Score [1] |
|||
|---|---|---|---|---|---|---|---|---|---|---|---|---|
| Benchmark | [-] | 0.137 | ||||||||||
| CLM-CRUJRA | [-] | 27.0 | 1.08 | 0.137 | 29.5 | 3.57 | 0.111 | 0.251 | 0.181 | |||
| CLM-GSWP3 | [-] | 18.2 | 1.17 | 0.137 | 18.6 | 3.90 | 0.0781 | 0.263 | 0.170 | |||
| CLM-Princeton | [-] | 43.6 | 1.15 | 0.137 | 47.3 | 3.84 | 0.133 | 0.117 | 0.125 | |||
| ISBA-CTRIP-CRUJRA | [-] | 15.6 | 0.327 | 0.137 | 15.6 | 0.732 | 0.531 | 0.816 | 0.673 | |||
| ISBA-CTRIP-GSWP3 | [-] | 13.9 | 0.285 | 0.137 | 13.9 | 0.577 | 0.572 | 0.862 | 0.717 | |||
| ISBA-CTRIP-Princeton | [-] | 21.1 | 0.390 | 0.137 | 21.2 | 0.984 | 0.463 | 0.663 | 0.563 | |||
| JSBACH-CRUJRA | [-] | 7.90 | 0.323 | 0.137 | 7.63 | 6.89e-05 | 0.754 | 0.486 | 0.468 | 0.477 | ||
| JSBACH-GSWP3 | [-] | 12.1 | 0.379 | 0.137 | 11.7 | 6.89e-05 | 1.02 | 0.395 | 0.371 | 0.383 | ||
| JSBACH-Princeton | [-] | 19.2 | 0.210 | 0.137 | 18.6 | 6.89e-05 | 0.334 | 0.403 | 0.429 | 0.416 | ||
| Mean-CRUJRA | [-] | 17.6 | 0.564 | 0.137 | 17.9 | 1.62 | 0.332 | 0.628 | 0.480 | |||
| Mean-GSWP3 | [-] | 14.9 | 0.602 | 0.137 | 15.0 | 1.76 | 0.288 | 0.613 | 0.451 | |||
| Mean-Princeton | [-] | 29.0 | 0.564 | 0.137 | 29.6 | 1.62 | 0.362 | 0.439 | 0.400 |
Download Data |
Period Mean (original grids) [Pg] |
Model Period Mean (intersection) [Pg] |
Benchmark Period Mean (intersection) [Pg] |
Model Period Mean (complement) [Pg] |
Benchmark Period Mean (complement) [Pg] |
Bias [kg m-2] |
Bias Score [1] |
Spatial Distribution Score [1] |
Overall Score [1] |
|||
|---|---|---|---|---|---|---|---|---|---|---|---|---|
| Benchmark | [-] | 4.36 | ||||||||||
| CLM-CRUJRA | [-] | 25.2 | 1.43 | 4.36 | 23.8 | 0.00445 | -1.27 | 0.444 | 0.240 | 0.342 | ||
| CLM-GSWP3 | [-] | 23.5 | 1.43 | 4.36 | 21.7 | 0.00445 | -1.27 | 0.454 | 0.192 | 0.323 | ||
| CLM-Princeton | [-] | 34.3 | 3.16 | 4.36 | 30.8 | 0.00445 | -0.542 | 0.526 | 0.644 | 0.585 | ||
| ISBA-CTRIP-CRUJRA | [-] | 43.1 | 3.56 | 4.36 | 39.7 | -0.352 | 0.543 | 0.509 | 0.526 | |||
| ISBA-CTRIP-GSWP3 | [-] | 43.4 | 3.81 | 4.36 | 39.3 | -0.240 | 0.549 | 0.462 | 0.505 | |||
| ISBA-CTRIP-Princeton | [-] | 57.6 | 5.08 | 4.36 | 52.2 | 0.310 | 0.584 | 0.712 | 0.648 | |||
| JSBACH-CRUJRA | [-] | 11.7 | 1.51 | 4.28 | 9.75 | 0.0860 | -1.20 | 0.405 | 0.136 | 0.270 | ||
| JSBACH-GSWP3 | [-] | 27.8 | 5.26 | 4.28 | 21.4 | 0.0860 | 0.472 | 0.532 | 0.311 | 0.421 | ||
| JSBACH-Princeton | [-] | 24.4 | 2.29 | 4.28 | 21.1 | 0.0860 | -0.854 | 0.438 | 0.121 | 0.279 | ||
| Mean-CRUJRA | [-] | 29.8 | 2.22 | 4.36 | 27.2 | -0.941 | 0.469 | 0.228 | 0.349 | |||
| Mean-GSWP3 | [-] | 34.3 | 3.55 | 4.36 | 30.2 | -0.357 | 0.528 | 0.215 | 0.371 | |||
| Mean-Princeton | [-] | 42.2 | 3.54 | 4.36 | 38.1 | -0.362 | 0.546 | 0.413 | 0.480 |
Temporally integrated period mean click to collapse contents