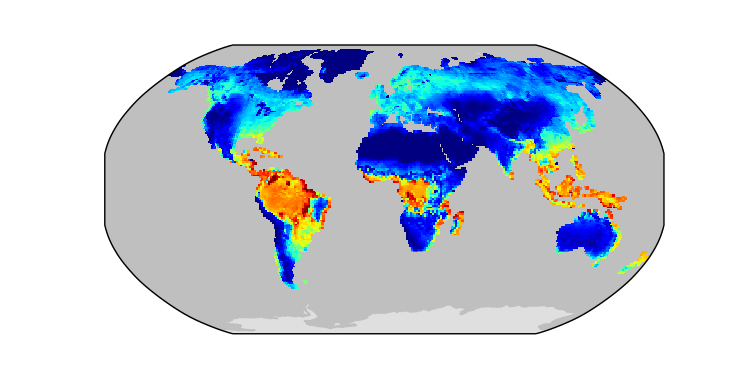
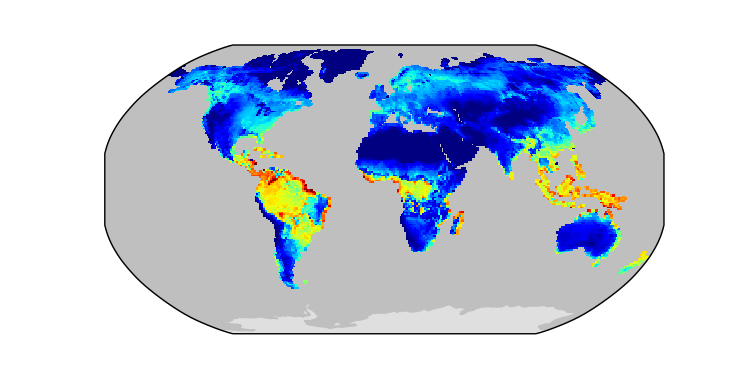
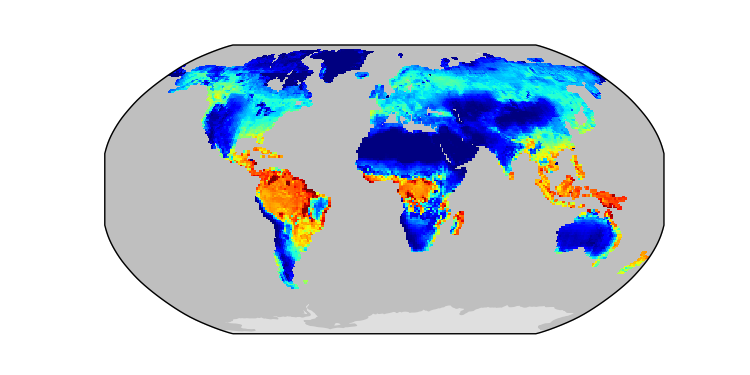
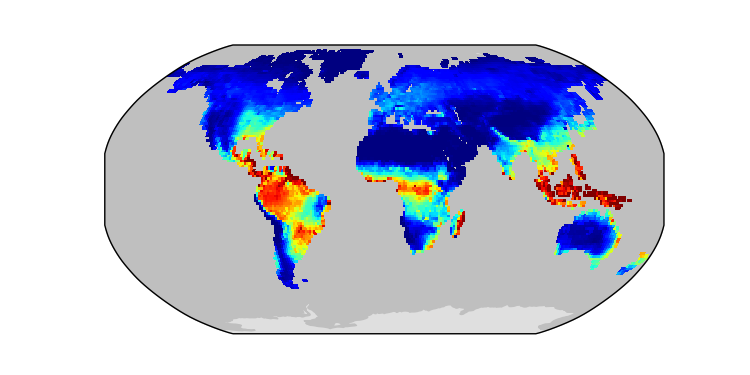
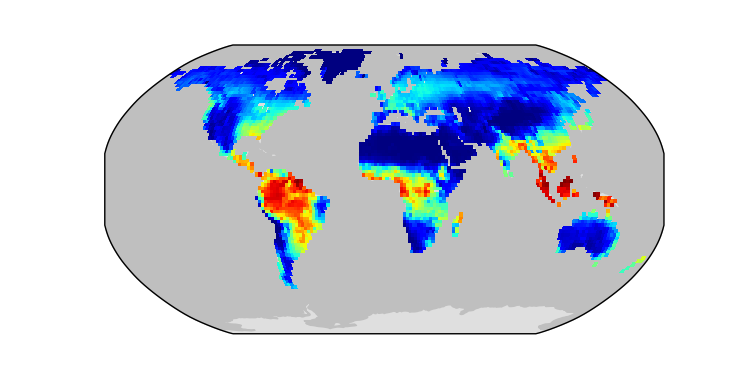
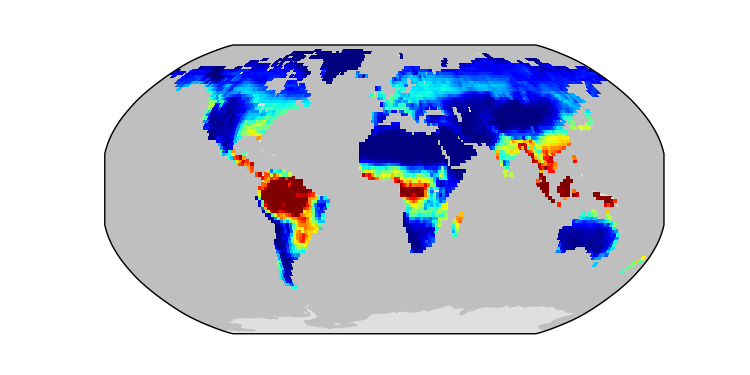
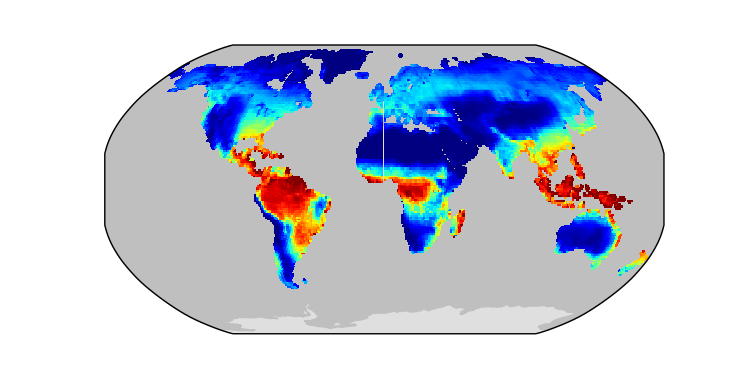
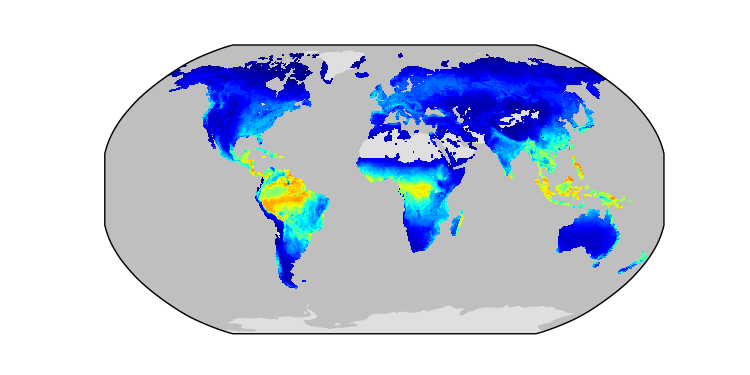
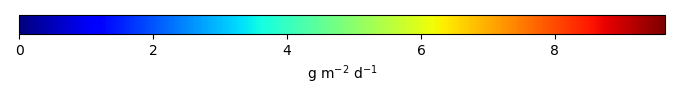
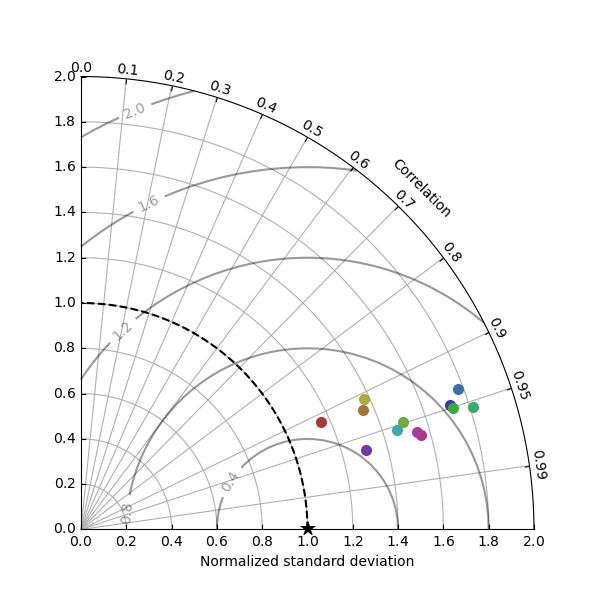
EcosystemRespiration / FLUXCOM / 1980-2014 / global / ISBA-CTRIP-CRUJRA
Global - Land
CLM-CRUJRA
Download Data |
Period Mean (original grids) [Pg yr-1] |
Model Period Mean (intersection) [Pg yr-1] |
Benchmark Period Mean (intersection) [Pg yr-1] |
Model Period Mean (complement) [Pg yr-1] |
Benchmark Period Mean (complement) [Pg yr-1] |
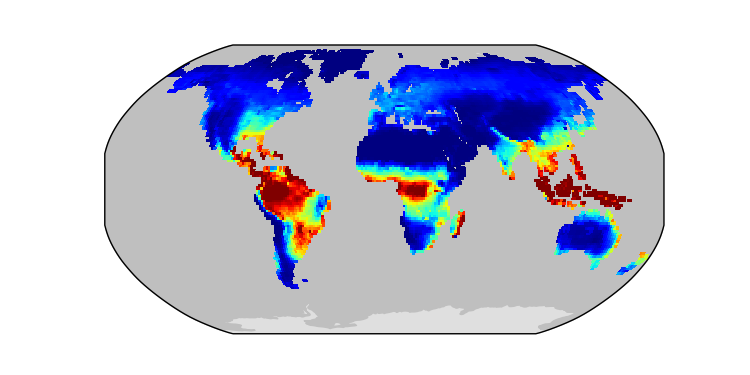
Bias [g m-2 d-1] |
RMSE [g m-2 d-1] |
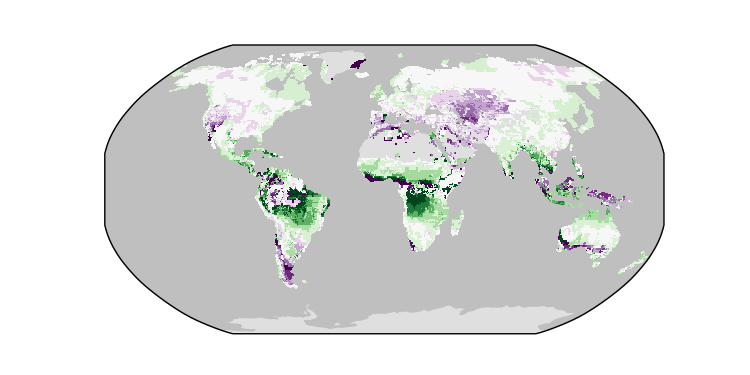
Phase Shift [months] |
Bias Score [1] |
RMSE Score [1] |
Seasonal Cycle Score [1] |
Spatial Distribution Score [1] |
Overall Score [1] |
|||
|---|---|---|---|---|---|---|---|---|---|---|---|---|---|---|---|---|
| Benchmark | [-] | 6.33 | ||||||||||||||
| CLM-CRUJRA | [-] | 13.4 | 12.9 | 6.32 | 0.397 | 0.0138 | 1.32 | 2.01 | 0.185 | 0.379 | 0.376 | 0.988 | 0.658 | 0.556 | ||
| CLM-GSWP3 | [-] | 11.8 | 11.4 | 6.32 | 0.357 | 0.0138 | 1.02 | 1.67 | 0.294 | 0.458 | 0.444 | 0.979 | 0.634 | 0.592 | ||
| CLM-Princeton | [-] | 16.6 | 16.0 | 6.32 | 0.485 | 0.0138 | 1.94 | 2.74 | 0.243 | 0.259 | 0.288 | 0.982 | 0.695 | 0.503 | ||
| ISBA-CTRIP-CRUJRA | [-] | 6.03 | 5.88 | 6.33 | 0.239 | 0.000603 | -0.0864 | 0.638 | 0.281 | 0.778 | 0.635 | 0.983 | 0.975 | 0.801 | ||
| ISBA-CTRIP-GSWP3 | [-] | 5.57 | 5.45 | 6.33 | 0.217 | 0.000603 | -0.172 | 0.674 | 0.386 | 0.760 | 0.619 | 0.976 | 0.956 | 0.786 | ||
| ISBA-CTRIP-Princeton | [-] | 7.93 | 7.76 | 6.33 | 0.289 | 0.000603 | 0.293 | 0.779 | 0.304 | 0.740 | 0.592 | 0.982 | 0.948 | 0.771 | ||
| JSBACH-CRUJRA | [-] | 10.5 | 10.2 | 6.17 | 0.254 | 0.168 | 0.837 | 1.62 | 0.596 | 0.501 | 0.384 | 0.959 | 0.664 | 0.579 | ||
| JSBACH-GSWP3 | [-] | 9.86 | 9.71 | 6.17 | 0.233 | 0.168 | 0.733 | 1.33 | 0.395 | 0.559 | 0.448 | 0.977 | 0.852 | 0.657 | ||
| JSBACH-Princeton | [-] | 10.3 | 10.1 | 6.17 | 0.240 | 0.168 | 0.820 | 1.53 | 0.492 | 0.527 | 0.413 | 0.969 | 0.714 | 0.607 | ||
| Mean-CRUJRA | [-] | 9.92 | 9.78 | 6.33 | 0.375 | 0.691 | 1.20 | 0.171 | 0.568 | 0.499 | 0.990 | 0.887 | 0.689 | |||
| Mean-GSWP3 | [-] | 8.98 | 8.92 | 6.33 | 0.340 | 0.518 | 0.975 | 0.178 | 0.638 | 0.559 | 0.990 | 0.948 | 0.739 | |||
| Mean-Princeton | [-] | 11.5 | 11.4 | 6.33 | 0.429 | 1.02 | 1.53 | 0.133 | 0.468 | 0.439 | 0.992 | 0.914 | 0.650 |
Download Data |
Period Mean (original grids) [Pg yr-1] |
Model Period Mean (intersection) [Pg yr-1] |
Benchmark Period Mean (intersection) [Pg yr-1] |
Model Period Mean (complement) [Pg yr-1] |
Benchmark Period Mean (complement) [Pg yr-1] |
Bias [g m-2 d-1] |
RMSE [g m-2 d-1] |
Phase Shift [months] |
Bias Score [1] |
RMSE Score [1] |
Seasonal Cycle Score [1] |
Spatial Distribution Score [1] |
Overall Score [1] |
|||
|---|---|---|---|---|---|---|---|---|---|---|---|---|---|---|---|---|
| Benchmark | [-] | 95.6 | ||||||||||||||
| CLM-CRUJRA | [-] | 148. | 128. | 95.2 | 18.6 | 0.505 | 0.765 | 1.57 | 0.986 | 0.336 | 0.392 | 0.818 | 0.879 | 0.563 | ||
| CLM-GSWP3 | [-] | 129. | 111. | 95.2 | 16.9 | 0.505 | 0.358 | 1.32 | 1.01 | 0.411 | 0.383 | 0.817 | 0.936 | 0.586 | ||
| CLM-Princeton | [-] | 161. | 142. | 95.1 | 19.1 | 0.505 | 1.08 | 1.89 | 0.965 | 0.294 | 0.376 | 0.827 | 0.862 | 0.547 | ||
| ISBA-CTRIP-CRUJRA | [-] | 156. | 128. | 95.6 | 26.2 | 0.0572 | 0.756 | 1.43 | 1.22 | 0.332 | 0.385 | 0.750 | 0.733 | 0.517 | ||
| ISBA-CTRIP-GSWP3 | [-] | 142. | 116. | 95.6 | 24.6 | 0.0572 | 0.472 | 1.23 | 1.26 | 0.405 | 0.367 | 0.742 | 0.830 | 0.542 | ||
| ISBA-CTRIP-Princeton | [-] | 176. | 146. | 95.6 | 28.2 | 0.0571 | 1.17 | 1.75 | 1.21 | 0.274 | 0.339 | 0.760 | 0.699 | 0.482 | ||
| JSBACH-CRUJRA | [-] | 135. | 128. | 87.8 | 8.35 | 7.91 | 0.995 | 1.81 | 1.03 | 0.282 | 0.327 | 0.823 | 0.708 | 0.494 | ||
| JSBACH-GSWP3 | [-] | 132. | 125. | 87.8 | 7.50 | 7.91 | 0.913 | 1.53 | 1.01 | 0.321 | 0.352 | 0.821 | 0.849 | 0.539 | ||
| JSBACH-Princeton | [-] | 134. | 128. | 87.8 | 7.53 | 7.91 | 0.976 | 1.74 | 1.03 | 0.277 | 0.355 | 0.825 | 0.736 | 0.510 | ||
| Mean-CRUJRA | [-] | 161. | 132. | 95.4 | 29.2 | 0.274 | 0.848 | 1.37 | 0.907 | 0.329 | 0.459 | 0.830 | 0.816 | 0.579 | ||
| Mean-GSWP3 | [-] | 148. | 121. | 95.4 | 26.9 | 0.274 | 0.583 | 1.10 | 0.926 | 0.425 | 0.449 | 0.824 | 0.915 | 0.612 | ||
| Mean-Princeton | [-] | 173. | 143. | 95.4 | 30.3 | 0.274 | 1.09 | 1.59 | 0.908 | 0.286 | 0.439 | 0.830 | 0.811 | 0.561 |
Download Data |
Period Mean (original grids) [Pg yr-1] |
Model Period Mean (intersection) [Pg yr-1] |
Benchmark Period Mean (intersection) [Pg yr-1] |
Model Period Mean (complement) [Pg yr-1] |
Benchmark Period Mean (complement) [Pg yr-1] |
Bias [g m-2 d-1] |
RMSE [g m-2 d-1] |
Phase Shift [months] |
Bias Score [1] |
RMSE Score [1] |
Seasonal Cycle Score [1] |
Spatial Distribution Score [1] |
Overall Score [1] |
|||
|---|---|---|---|---|---|---|---|---|---|---|---|---|---|---|---|---|
| Benchmark | [-] | 7.76 | ||||||||||||||
| CLM-CRUJRA | [-] | 7.42 | 6.71 | 7.73 | 0.530 | 0.0353 | -0.151 | 0.815 | 1.20 | 0.530 | 0.286 | 0.852 | 0.929 | 0.576 | ||
| CLM-GSWP3 | [-] | 6.79 | 6.33 | 7.73 | 0.399 | 0.0353 | -0.209 | 0.789 | 1.19 | 0.541 | 0.299 | 0.860 | 0.946 | 0.589 | ||
| CLM-Princeton | [-] | 7.36 | 6.74 | 7.73 | 0.464 | 0.0353 | -0.144 | 0.830 | 1.08 | 0.530 | 0.283 | 0.869 | 0.880 | 0.569 | ||
| ISBA-CTRIP-CRUJRA | [-] | 6.95 | 5.76 | 7.76 | 0.799 | 0.00473 | -0.291 | 0.811 | 1.13 | 0.430 | 0.369 | 0.868 | 0.753 | 0.558 | ||
| ISBA-CTRIP-GSWP3 | [-] | 6.49 | 5.48 | 7.76 | 0.671 | 0.00473 | -0.333 | 0.833 | 1.15 | 0.425 | 0.343 | 0.865 | 0.814 | 0.558 | ||
| ISBA-CTRIP-Princeton | [-] | 7.96 | 6.69 | 7.76 | 0.820 | 0.00473 | -0.148 | 0.947 | 1.17 | 0.400 | 0.314 | 0.862 | 0.610 | 0.500 | ||
| JSBACH-CRUJRA | [-] | 5.63 | 5.30 | 7.44 | 0.352 | 0.322 | -0.332 | 0.831 | 1.08 | 0.397 | 0.364 | 0.873 | 0.775 | 0.554 | ||
| JSBACH-GSWP3 | [-] | 6.74 | 6.26 | 7.44 | 0.508 | 0.322 | -0.181 | 0.786 | 1.09 | 0.494 | 0.320 | 0.873 | 0.816 | 0.565 | ||
| JSBACH-Princeton | [-] | 5.34 | 5.10 | 7.44 | 0.228 | 0.322 | -0.364 | 0.862 | 1.10 | 0.377 | 0.366 | 0.867 | 0.730 | 0.541 | ||
| Mean-CRUJRA | [-] | 7.00 | 6.04 | 7.73 | 0.944 | 0.0344 | -0.255 | 0.650 | 1.08 | 0.512 | 0.397 | 0.878 | 0.908 | 0.618 | ||
| Mean-GSWP3 | [-] | 7.02 | 6.14 | 7.73 | 0.832 | 0.0344 | -0.241 | 0.652 | 1.06 | 0.542 | 0.370 | 0.884 | 0.939 | 0.621 | ||
| Mean-Princeton | [-] | 7.30 | 6.32 | 7.73 | 0.918 | 0.0344 | -0.212 | 0.705 | 1.07 | 0.498 | 0.372 | 0.881 | 0.825 | 0.590 |
Download Data |
Period Mean (original grids) [Pg yr-1] |
Model Period Mean (intersection) [Pg yr-1] |
Benchmark Period Mean (intersection) [Pg yr-1] |
Model Period Mean (complement) [Pg yr-1] |
Benchmark Period Mean (complement) [Pg yr-1] |
Bias [g m-2 d-1] |
RMSE [g m-2 d-1] |
Phase Shift [months] |
Bias Score [1] |
RMSE Score [1] |
Seasonal Cycle Score [1] |
Spatial Distribution Score [1] |
Overall Score [1] |
|||
|---|---|---|---|---|---|---|---|---|---|---|---|---|---|---|---|---|
| Benchmark | [-] | 1.57 | ||||||||||||||
| CLM-CRUJRA | [-] | 1.63 | 1.45 | 1.57 | 0.152 | 0.00120 | -0.0410 | 0.600 | 0.923 | 0.404 | 0.264 | 0.902 | 0.590 | 0.485 | ||
| CLM-GSWP3 | [-] | 1.48 | 1.32 | 1.57 | 0.128 | 0.00120 | -0.0875 | 0.577 | 1.02 | 0.398 | 0.285 | 0.887 | 0.617 | 0.494 | ||
| CLM-Princeton | [-] | 1.78 | 1.60 | 1.57 | 0.166 | 0.00120 | 0.0200 | 0.641 | 1.04 | 0.410 | 0.244 | 0.885 | 0.544 | 0.466 | ||
| ISBA-CTRIP-CRUJRA | [-] | 1.01 | 0.846 | 1.57 | 0.102 | -0.300 | 0.511 | 1.45 | 0.314 | 0.392 | 0.819 | 0.675 | 0.518 | |||
| ISBA-CTRIP-GSWP3 | [-] | 1.10 | 0.916 | 1.57 | 0.113 | -0.270 | 0.527 | 1.32 | 0.333 | 0.370 | 0.833 | 0.590 | 0.499 | |||
| ISBA-CTRIP-Princeton | [-] | 1.20 | 1.03 | 1.57 | 0.110 | -0.225 | 0.535 | 1.45 | 0.342 | 0.357 | 0.819 | 0.538 | 0.483 | |||
| JSBACH-CRUJRA | [-] | 0.813 | 0.722 | 1.51 | 0.0632 | 0.0569 | -0.334 | 0.538 | 1.01 | 0.314 | 0.353 | 0.899 | 0.800 | 0.544 | ||
| JSBACH-GSWP3 | [-] | 1.42 | 1.28 | 1.51 | 0.0834 | 0.0569 | -0.101 | 0.556 | 1.03 | 0.445 | 0.277 | 0.893 | 0.710 | 0.520 | ||
| JSBACH-Princeton | [-] | 0.806 | 0.716 | 1.51 | 0.0419 | 0.0569 | -0.336 | 0.515 | 1.01 | 0.339 | 0.365 | 0.898 | 0.831 | 0.560 | ||
| Mean-CRUJRA | [-] | 1.14 | 1.00 | 1.56 | 0.127 | 0.00822 | -0.230 | 0.451 | 0.979 | 0.408 | 0.384 | 0.898 | 0.811 | 0.577 | ||
| Mean-GSWP3 | [-] | 1.33 | 1.17 | 1.56 | 0.128 | 0.00822 | -0.162 | 0.445 | 1.03 | 0.469 | 0.356 | 0.892 | 0.822 | 0.579 | ||
| Mean-Princeton | [-] | 1.28 | 1.11 | 1.56 | 0.127 | 0.00821 | -0.184 | 0.455 | 1.09 | 0.442 | 0.359 | 0.884 | 0.773 | 0.563 |
Download Data |
Period Mean (original grids) [Pg yr-1] |
Model Period Mean (intersection) [Pg yr-1] |
Benchmark Period Mean (intersection) [Pg yr-1] |
Model Period Mean (complement) [Pg yr-1] |
Benchmark Period Mean (complement) [Pg yr-1] |
Bias [g m-2 d-1] |
RMSE [g m-2 d-1] |
Phase Shift [months] |
Bias Score [1] |
RMSE Score [1] |
Seasonal Cycle Score [1] |
Spatial Distribution Score [1] |
Overall Score [1] |
|||
|---|---|---|---|---|---|---|---|---|---|---|---|---|---|---|---|---|
| Benchmark | [-] | 0.507 | ||||||||||||||
| CLM-CRUJRA | [-] | 1.01 | 0.825 | 0.491 | 0.129 | 0.0163 | 1.86 | 2.13 | 0.792 | 0.187 | 0.409 | 0.865 | 0.874 | 0.549 | ||
| CLM-GSWP3 | [-] | 0.941 | 0.788 | 0.491 | 0.108 | 0.0163 | 1.67 | 1.92 | 0.915 | 0.222 | 0.444 | 0.857 | 0.829 | 0.559 | ||
| CLM-Princeton | [-] | 1.14 | 0.945 | 0.491 | 0.130 | 0.0163 | 2.53 | 2.68 | 0.818 | 0.139 | 0.431 | 0.885 | 0.831 | 0.543 | ||
| ISBA-CTRIP-CRUJRA | [-] | 0.756 | 0.723 | 0.507 | 0.115 | 0.000252 | 1.20 | 2.02 | 1.15 | 0.304 | 0.420 | 0.853 | 0.424 | 0.484 | ||
| ISBA-CTRIP-GSWP3 | [-] | 0.741 | 0.653 | 0.507 | 0.116 | 0.000252 | 0.832 | 1.71 | 1.37 | 0.301 | 0.432 | 0.793 | 0.535 | 0.498 | ||
| ISBA-CTRIP-Princeton | [-] | 0.910 | 0.787 | 0.507 | 0.143 | 0.000252 | 1.54 | 2.04 | 1.21 | 0.309 | 0.430 | 0.833 | 0.474 | 0.495 | ||
| JSBACH-CRUJRA | [-] | 1.09 | 0.803 | 0.389 | 0.0670 | 0.118 | 2.80 | 3.05 | 0.918 | 0.0976 | 0.248 | 0.881 | 0.684 | 0.432 | ||
| JSBACH-GSWP3 | [-] | 0.920 | 0.676 | 0.389 | 0.0536 | 0.118 | 1.93 | 2.18 | 1.46 | 0.179 | 0.362 | 0.743 | 0.784 | 0.486 | ||
| JSBACH-Princeton | [-] | 1.02 | 0.770 | 0.389 | 0.0604 | 0.118 | 2.58 | 2.78 | 1.24 | 0.107 | 0.351 | 0.787 | 0.725 | 0.464 | ||
| Mean-CRUJRA | [-] | 1.19 | 0.834 | 0.506 | 0.151 | 0.00145 | 1.72 | 1.91 | 0.675 | 0.250 | 0.475 | 0.899 | 0.718 | 0.564 | ||
| Mean-GSWP3 | [-] | 1.09 | 0.757 | 0.506 | 0.141 | 0.00145 | 1.31 | 1.58 | 0.759 | 0.311 | 0.524 | 0.872 | 0.763 | 0.599 | ||
| Mean-Princeton | [-] | 1.28 | 0.895 | 0.505 | 0.172 | 0.00145 | 2.03 | 2.20 | 0.601 | 0.213 | 0.506 | 0.915 | 0.705 | 0.569 |
Download Data |
Period Mean (original grids) [Pg yr-1] |
Model Period Mean (intersection) [Pg yr-1] |
Benchmark Period Mean (intersection) [Pg yr-1] |
Model Period Mean (complement) [Pg yr-1] |
Benchmark Period Mean (complement) [Pg yr-1] |
Bias [g m-2 d-1] |
RMSE [g m-2 d-1] |
Phase Shift [months] |
Bias Score [1] |
RMSE Score [1] |
Seasonal Cycle Score [1] |
Spatial Distribution Score [1] |
Overall Score [1] |
|||
|---|---|---|---|---|---|---|---|---|---|---|---|---|---|---|---|---|
| Benchmark | [-] | 12.2 | ||||||||||||||
| CLM-CRUJRA | [-] | 19.0 | 17.5 | 12.1 | 1.42 | 0.0779 | 1.01 | 1.48 | 0.446 | 0.493 | 0.597 | 0.959 | 0.882 | 0.706 | ||
| CLM-GSWP3 | [-] | 16.9 | 15.5 | 12.1 | 1.24 | 0.0779 | 0.635 | 1.25 | 0.524 | 0.596 | 0.600 | 0.952 | 0.904 | 0.730 | ||
| CLM-Princeton | [-] | 21.3 | 19.6 | 12.1 | 1.46 | 0.0779 | 1.41 | 1.84 | 0.513 | 0.426 | 0.569 | 0.955 | 0.867 | 0.677 | ||
| ISBA-CTRIP-CRUJRA | [-] | 15.9 | 14.5 | 12.2 | 1.32 | 0.00277 | 0.453 | 1.27 | 0.591 | 0.608 | 0.564 | 0.950 | 0.642 | 0.665 | ||
| ISBA-CTRIP-GSWP3 | [-] | 15.6 | 14.1 | 12.2 | 1.30 | 0.00277 | 0.378 | 1.24 | 0.590 | 0.622 | 0.568 | 0.946 | 0.704 | 0.682 | ||
| ISBA-CTRIP-Princeton | [-] | 20.6 | 18.8 | 12.2 | 1.62 | 0.00277 | 1.26 | 1.80 | 0.587 | 0.473 | 0.526 | 0.950 | 0.523 | 0.600 | ||
| JSBACH-CRUJRA | [-] | 18.9 | 17.7 | 11.1 | 0.825 | 1.06 | 1.33 | 2.05 | 0.601 | 0.414 | 0.431 | 0.948 | 0.556 | 0.556 | ||
| JSBACH-GSWP3 | [-] | 19.2 | 18.0 | 11.1 | 0.777 | 1.06 | 1.39 | 1.90 | 0.580 | 0.422 | 0.482 | 0.946 | 0.851 | 0.637 | ||
| JSBACH-Princeton | [-] | 19.1 | 17.9 | 11.1 | 0.795 | 1.06 | 1.38 | 1.98 | 0.573 | 0.412 | 0.458 | 0.951 | 0.717 | 0.599 | ||
| Mean-CRUJRA | [-] | 18.4 | 17.0 | 12.1 | 1.58 | 0.0337 | 0.916 | 1.30 | 0.396 | 0.530 | 0.619 | 0.965 | 0.793 | 0.705 | ||
| Mean-GSWP3 | [-] | 17.6 | 16.3 | 12.1 | 1.48 | 0.0337 | 0.778 | 1.14 | 0.406 | 0.591 | 0.646 | 0.963 | 0.915 | 0.752 | ||
| Mean-Princeton | [-] | 20.9 | 19.2 | 12.1 | 1.75 | 0.0337 | 1.34 | 1.67 | 0.370 | 0.430 | 0.585 | 0.969 | 0.807 | 0.675 |
Download Data |
Period Mean (original grids) [Pg yr-1] |
Model Period Mean (intersection) [Pg yr-1] |
Benchmark Period Mean (intersection) [Pg yr-1] |
Model Period Mean (complement) [Pg yr-1] |
Benchmark Period Mean (complement) [Pg yr-1] |
Bias [g m-2 d-1] |
RMSE [g m-2 d-1] |
Phase Shift [months] |
Bias Score [1] |
RMSE Score [1] |
Seasonal Cycle Score [1] |
Spatial Distribution Score [1] |
Overall Score [1] |
|||
|---|---|---|---|---|---|---|---|---|---|---|---|---|---|---|---|---|
| Benchmark | [-] | 8.93 | ||||||||||||||
| CLM-CRUJRA | [-] | 12.5 | 11.3 | 8.75 | 0.952 | 0.180 | 1.61 | 1.78 | 2.45 | 0.120 | 0.266 | 0.617 | 0.918 | 0.437 | ||
| CLM-GSWP3 | [-] | 11.3 | 10.2 | 8.75 | 0.890 | 0.180 | 0.936 | 1.38 | 2.56 | 0.179 | 0.236 | 0.606 | 0.920 | 0.435 | ||
| CLM-Princeton | [-] | 12.9 | 11.7 | 8.75 | 0.977 | 0.180 | 1.86 | 2.01 | 2.35 | 0.0952 | 0.258 | 0.639 | 0.944 | 0.439 | ||
| ISBA-CTRIP-CRUJRA | [-] | 17.6 | 15.4 | 8.92 | 2.07 | 0.00479 | 4.02 | 4.07 | 2.41 | 0.0111 | 0.250 | 0.611 | 0.988 | 0.422 | ||
| ISBA-CTRIP-GSWP3 | [-] | 15.6 | 13.6 | 8.92 | 1.94 | 0.00479 | 2.92 | 3.03 | 2.44 | 0.0338 | 0.203 | 0.616 | 0.982 | 0.407 | ||
| ISBA-CTRIP-Princeton | [-] | 17.3 | 15.1 | 8.92 | 2.08 | 0.00479 | 3.80 | 3.87 | 2.49 | 0.0124 | 0.195 | 0.596 | 0.989 | 0.398 | ||
| JSBACH-CRUJRA | [-] | 15.6 | 14.0 | 7.42 | 0.537 | 1.50 | 4.80 | 4.87 | 2.07 | 0.00372 | 0.192 | 0.669 | 0.974 | 0.406 | ||
| JSBACH-GSWP3 | [-] | 12.7 | 11.3 | 7.42 | 0.443 | 1.50 | 2.88 | 2.98 | 2.56 | 0.0249 | 0.203 | 0.578 | 0.947 | 0.391 | ||
| JSBACH-Princeton | [-] | 14.5 | 13.0 | 7.42 | 0.496 | 1.50 | 4.08 | 4.12 | 2.29 | 0.00637 | 0.245 | 0.631 | 0.932 | 0.412 | ||
| Mean-CRUJRA | [-] | 16.0 | 14.4 | 8.93 | 1.96 | 3.37 | 3.41 | 2.01 | 0.0116 | 0.347 | 0.686 | 0.874 | 0.453 | |||
| Mean-GSWP3 | [-] | 14.0 | 12.6 | 8.93 | 1.82 | 2.23 | 2.30 | 2.19 | 0.0516 | 0.313 | 0.661 | 0.897 | 0.447 | |||
| Mean-Princeton | [-] | 15.8 | 14.2 | 8.93 | 1.98 | 3.22 | 3.26 | 2.07 | 0.0123 | 0.344 | 0.670 | 0.907 | 0.455 |
Download Data |
Period Mean (original grids) [Pg yr-1] |
Model Period Mean (intersection) [Pg yr-1] |
Benchmark Period Mean (intersection) [Pg yr-1] |
Model Period Mean (complement) [Pg yr-1] |
Benchmark Period Mean (complement) [Pg yr-1] |
Bias [g m-2 d-1] |
RMSE [g m-2 d-1] |
Phase Shift [months] |
Bias Score [1] |
RMSE Score [1] |
Seasonal Cycle Score [1] |
Spatial Distribution Score [1] |
Overall Score [1] |
|||
|---|---|---|---|---|---|---|---|---|---|---|---|---|---|---|---|---|
| Benchmark | [-] | 48.1 | ||||||||||||||
| CLM-CRUJRA | [-] | 65.8 | 60.1 | 47.6 | 5.04 | 0.477 | 1.04 | 2.06 | 1.62 | 0.275 | 0.398 | 0.757 | 0.728 | 0.511 | ||
| CLM-GSWP3 | [-] | 54.9 | 49.6 | 47.6 | 4.67 | 0.477 | 0.165 | 1.67 | 1.59 | 0.360 | 0.363 | 0.762 | 0.845 | 0.539 | ||
| CLM-Princeton | [-] | 69.0 | 63.2 | 47.6 | 5.17 | 0.476 | 1.29 | 2.21 | 1.55 | 0.245 | 0.399 | 0.772 | 0.713 | 0.506 | ||
| ISBA-CTRIP-CRUJRA | [-] | 81.9 | 74.0 | 48.0 | 8.71 | 0.0578 | 2.15 | 2.63 | 2.19 | 0.182 | 0.314 | 0.630 | 0.782 | 0.444 | ||
| ISBA-CTRIP-GSWP3 | [-] | 70.8 | 63.9 | 48.0 | 7.90 | 0.0578 | 1.31 | 1.97 | 2.30 | 0.326 | 0.294 | 0.615 | 0.873 | 0.480 | ||
| ISBA-CTRIP-Princeton | [-] | 89.1 | 80.8 | 48.0 | 9.23 | 0.0578 | 2.71 | 3.18 | 2.14 | 0.137 | 0.275 | 0.654 | 0.764 | 0.421 | ||
| JSBACH-CRUJRA | [-] | 68.7 | 66.8 | 43.4 | 2.13 | 4.67 | 2.11 | 2.82 | 1.61 | 0.191 | 0.298 | 0.759 | 0.659 | 0.441 | ||
| JSBACH-GSWP3 | [-] | 63.5 | 61.8 | 43.4 | 1.81 | 4.67 | 1.66 | 2.19 | 1.51 | 0.242 | 0.340 | 0.770 | 0.891 | 0.516 | ||
| JSBACH-Princeton | [-] | 68.3 | 66.7 | 43.4 | 1.95 | 4.67 | 2.10 | 2.72 | 1.59 | 0.180 | 0.333 | 0.769 | 0.696 | 0.462 | ||
| Mean-CRUJRA | [-] | 78.5 | 69.4 | 47.9 | 8.40 | 0.158 | 1.78 | 2.18 | 1.58 | 0.219 | 0.448 | 0.760 | 0.796 | 0.534 | ||
| Mean-GSWP3 | [-] | 69.0 | 60.7 | 47.9 | 7.66 | 0.158 | 1.05 | 1.53 | 1.60 | 0.373 | 0.422 | 0.753 | 0.927 | 0.579 | ||
| Mean-Princeton | [-] | 82.4 | 72.9 | 47.9 | 8.73 | 0.158 | 2.07 | 2.39 | 1.58 | 0.198 | 0.444 | 0.762 | 0.799 | 0.529 |
Download Data |
Period Mean (original grids) [Pg yr-1] |
Model Period Mean (intersection) [Pg yr-1] |
Benchmark Period Mean (intersection) [Pg yr-1] |
Model Period Mean (complement) [Pg yr-1] |
Benchmark Period Mean (complement) [Pg yr-1] |
Bias [g m-2 d-1] |
RMSE [g m-2 d-1] |
Phase Shift [months] |
Bias Score [1] |
RMSE Score [1] |
Seasonal Cycle Score [1] |
Spatial Distribution Score [1] |
Overall Score [1] |
|||
|---|---|---|---|---|---|---|---|---|---|---|---|---|---|---|---|---|
| Benchmark | [-] | 2.76 | ||||||||||||||
| CLM-CRUJRA | [-] | 5.76 | 7.02 | 2.75 | 0.315 | 0.00256 | 0.991 | 2.06 | 0.441 | 0.273 | 0.184 | 0.971 | 0.398 | 0.402 | ||
| CLM-GSWP3 | [-] | 4.89 | 5.51 | 2.75 | 0.214 | 0.00256 | 0.638 | 1.60 | 0.465 | 0.381 | 0.285 | 0.968 | 0.408 | 0.465 | ||
| CLM-Princeton | [-] | 8.52 | 9.98 | 2.75 | 0.447 | 0.00256 | 1.68 | 3.02 | 0.390 | 0.137 | 0.0924 | 0.972 | 0.304 | 0.320 | ||
| ISBA-CTRIP-CRUJRA | [-] | 2.98 | 2.88 | 2.76 | 0.124 | 0.000112 | 0.0291 | 0.469 | 0.421 | 0.764 | 0.525 | 0.977 | 0.972 | 0.753 | ||
| ISBA-CTRIP-GSWP3 | [-] | 2.76 | 2.66 | 2.76 | 0.113 | 0.000112 | -0.0209 | 0.462 | 0.386 | 0.770 | 0.523 | 0.977 | 0.969 | 0.753 | ||
| ISBA-CTRIP-Princeton | [-] | 3.91 | 3.79 | 2.75 | 0.140 | 0.000112 | 0.242 | 0.665 | 0.279 | 0.645 | 0.431 | 0.985 | 0.839 | 0.666 | ||
| JSBACH-CRUJRA | [-] | 2.88 | 5.17 | 2.69 | 0.236 | 0.0686 | 0.605 | 1.33 | 0.560 | 0.461 | 0.267 | 0.969 | 0.784 | 0.550 | ||
| JSBACH-GSWP3 | [-] | 3.78 | 4.85 | 2.69 | 0.186 | 0.0686 | 0.526 | 1.21 | 0.703 | 0.514 | 0.284 | 0.961 | 0.855 | 0.580 | ||
| JSBACH-Princeton | [-] | 3.23 | 4.85 | 2.69 | 0.207 | 0.0686 | 0.529 | 1.28 | 0.654 | 0.494 | 0.275 | 0.965 | 0.794 | 0.560 | ||
| Mean-CRUJRA | [-] | 5.17 | 5.06 | 2.76 | 0.267 | 8.86e-05 | 0.531 | 1.13 | 0.311 | 0.477 | 0.304 | 0.987 | 0.804 | 0.575 | ||
| Mean-GSWP3 | [-] | 4.46 | 4.37 | 2.76 | 0.213 | 8.86e-05 | 0.373 | 0.930 | 0.308 | 0.558 | 0.367 | 0.987 | 0.865 | 0.629 | ||
| Mean-Princeton | [-] | 6.43 | 6.28 | 2.75 | 0.324 | 8.86e-05 | 0.814 | 1.53 | 0.262 | 0.335 | 0.216 | 0.988 | 0.675 | 0.486 |
Download Data |
Period Mean (original grids) [Pg yr-1] |
Model Period Mean (intersection) [Pg yr-1] |
Benchmark Period Mean (intersection) [Pg yr-1] |
Model Period Mean (complement) [Pg yr-1] |
Benchmark Period Mean (complement) [Pg yr-1] |
Bias [g m-2 d-1] |
RMSE [g m-2 d-1] |
Phase Shift [months] |
Bias Score [1] |
RMSE Score [1] |
Seasonal Cycle Score [1] |
Spatial Distribution Score [1] |
Overall Score [1] |
|||
|---|---|---|---|---|---|---|---|---|---|---|---|---|---|---|---|---|
| Benchmark | [-] | 8.17 | ||||||||||||||
| CLM-CRUJRA | [-] | 11.7 | 10.9 | 8.13 | 0.686 | 0.0446 | 0.463 | 1.12 | 0.659 | 0.485 | 0.395 | 0.934 | 0.846 | 0.611 | ||
| CLM-GSWP3 | [-] | 11.1 | 10.3 | 8.13 | 0.642 | 0.0446 | 0.366 | 1.04 | 0.682 | 0.547 | 0.405 | 0.932 | 0.915 | 0.641 | ||
| CLM-Princeton | [-] | 13.7 | 12.7 | 8.13 | 0.749 | 0.0446 | 0.776 | 1.38 | 0.683 | 0.433 | 0.355 | 0.931 | 0.820 | 0.579 | ||
| ISBA-CTRIP-CRUJRA | [-] | 9.99 | 9.13 | 8.17 | 0.690 | 0.00245 | 0.156 | 0.885 | 0.876 | 0.553 | 0.450 | 0.919 | 0.754 | 0.625 | ||
| ISBA-CTRIP-GSWP3 | [-] | 10.9 | 9.99 | 8.17 | 0.713 | 0.00245 | 0.298 | 0.966 | 0.881 | 0.533 | 0.432 | 0.916 | 0.735 | 0.610 | ||
| ISBA-CTRIP-Princeton | [-] | 13.4 | 12.3 | 8.17 | 0.850 | 0.00245 | 0.680 | 1.27 | 0.910 | 0.438 | 0.374 | 0.913 | 0.579 | 0.535 | ||
| JSBACH-CRUJRA | [-] | 8.37 | 7.90 | 7.64 | 0.233 | 0.538 | 0.0491 | 0.973 | 0.694 | 0.529 | 0.410 | 0.927 | 0.763 | 0.608 | ||
| JSBACH-GSWP3 | [-] | 11.6 | 11.3 | 7.64 | 0.245 | 0.538 | 0.637 | 1.24 | 0.694 | 0.463 | 0.365 | 0.929 | 0.800 | 0.585 | ||
| JSBACH-Princeton | [-] | 8.98 | 8.57 | 7.64 | 0.212 | 0.538 | 0.167 | 1.02 | 0.691 | 0.513 | 0.405 | 0.927 | 0.729 | 0.596 | ||
| Mean-CRUJRA | [-] | 10.3 | 9.50 | 8.12 | 0.773 | 0.0596 | 0.232 | 0.773 | 0.542 | 0.587 | 0.493 | 0.954 | 0.850 | 0.675 | ||
| Mean-GSWP3 | [-] | 11.6 | 10.7 | 8.12 | 0.768 | 0.0596 | 0.436 | 0.879 | 0.588 | 0.549 | 0.472 | 0.947 | 0.891 | 0.666 | ||
| Mean-Princeton | [-] | 12.4 | 11.4 | 8.11 | 0.885 | 0.0596 | 0.555 | 1.01 | 0.587 | 0.493 | 0.438 | 0.950 | 0.775 | 0.619 |
Temporally integrated period mean click to collapse contents


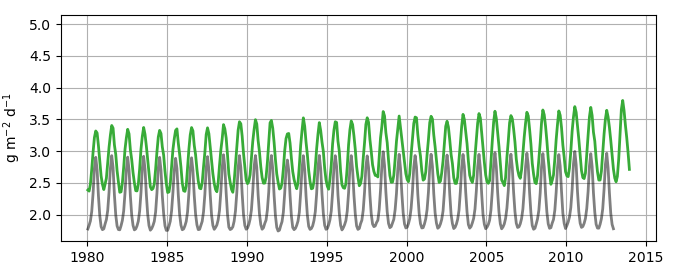
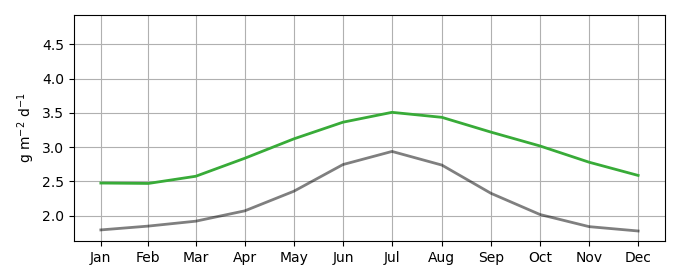
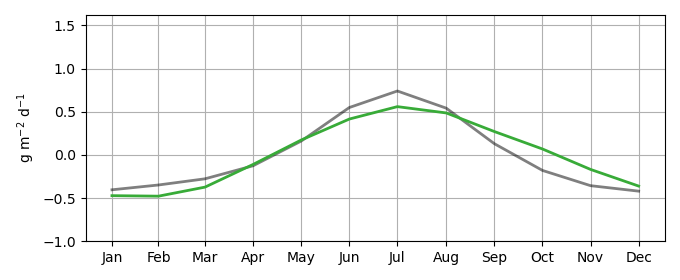
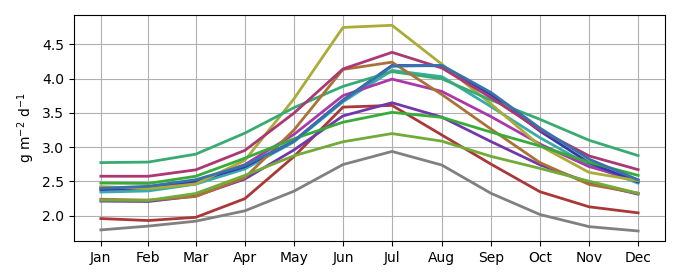
Spatially integrated regional mean click to collapse contents