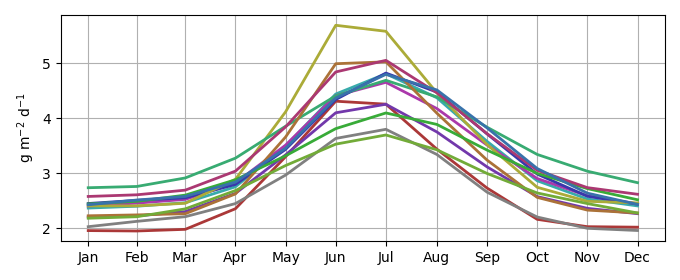
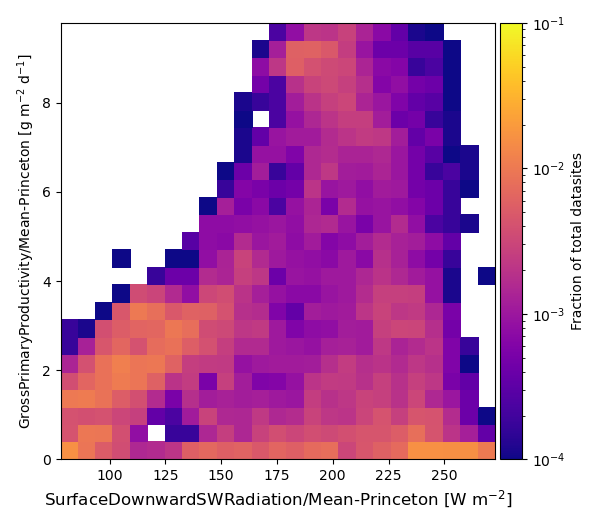
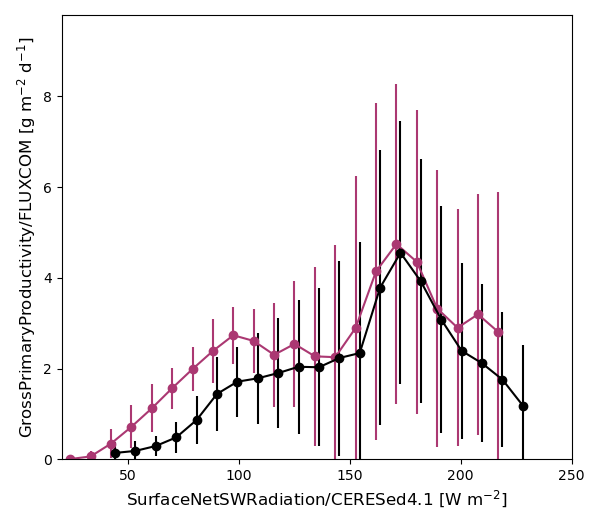
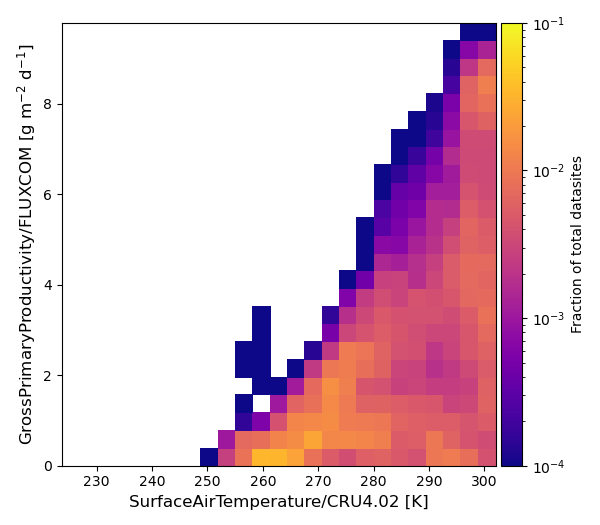
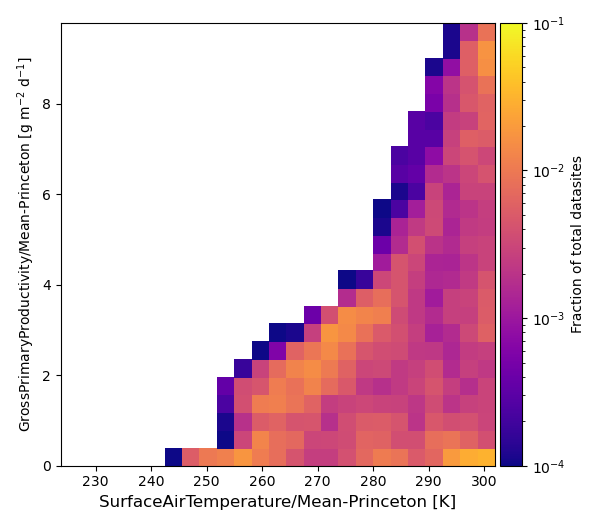
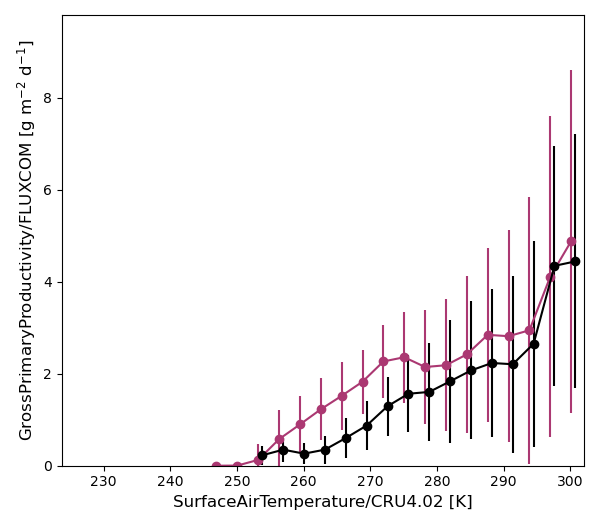
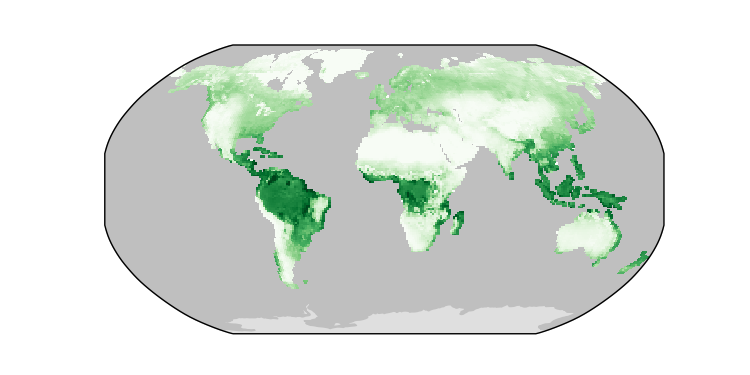
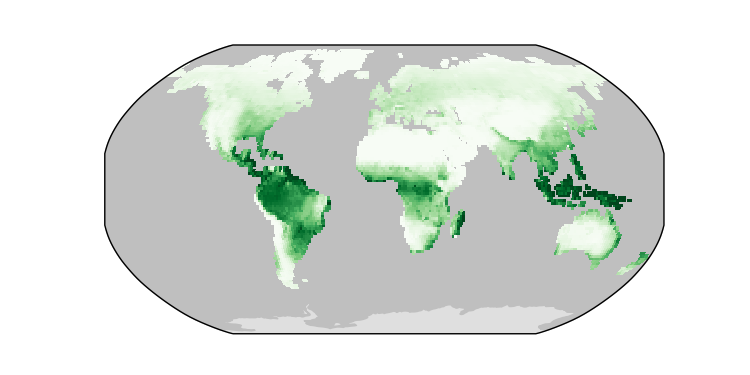
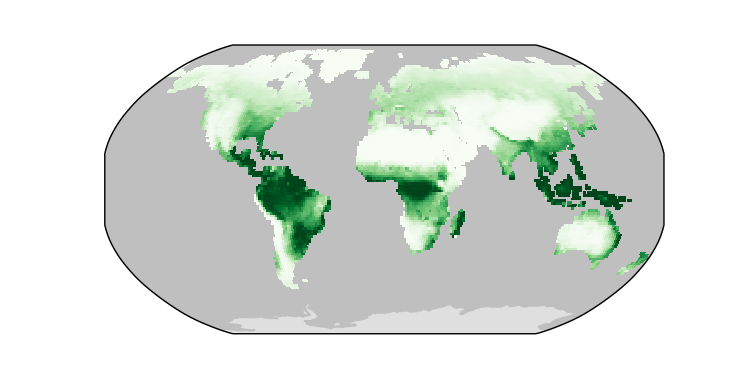
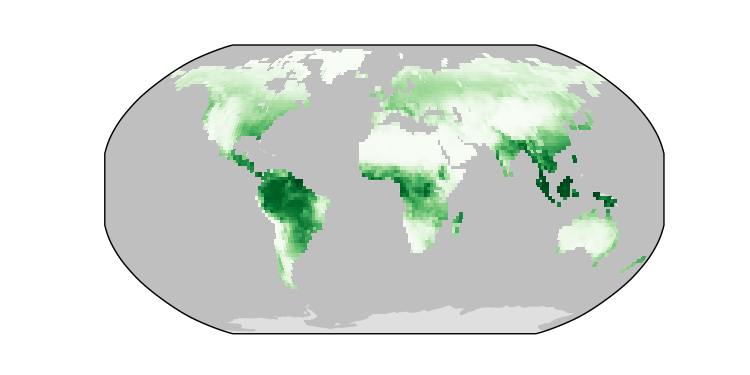
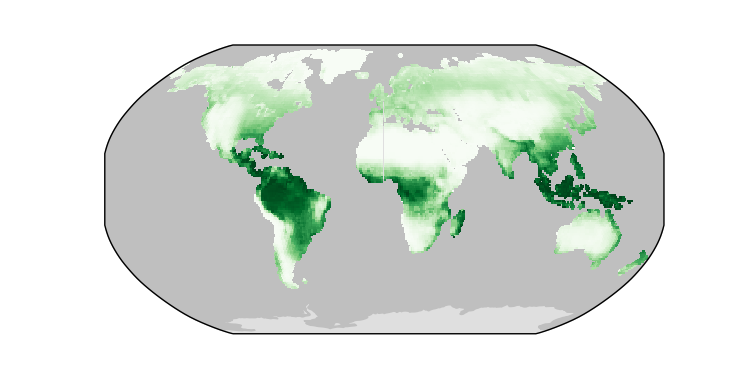
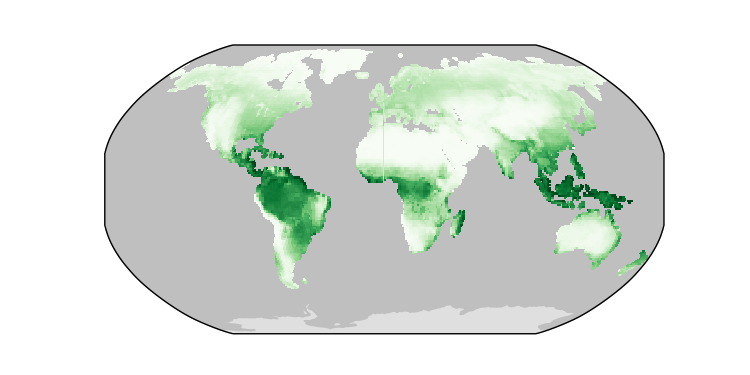
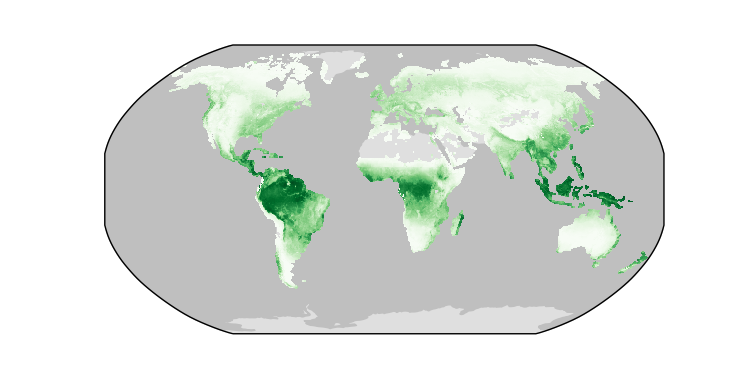
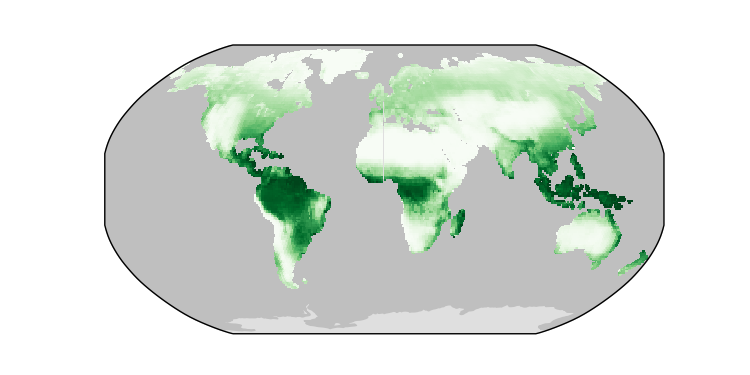
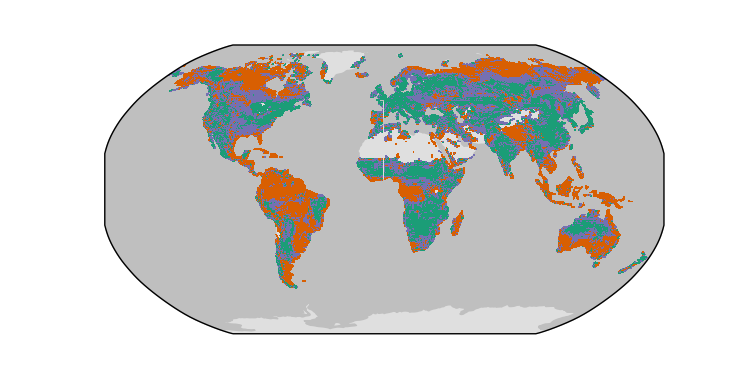
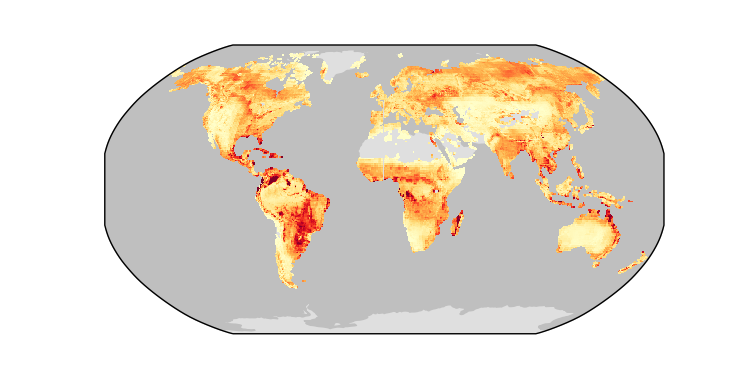
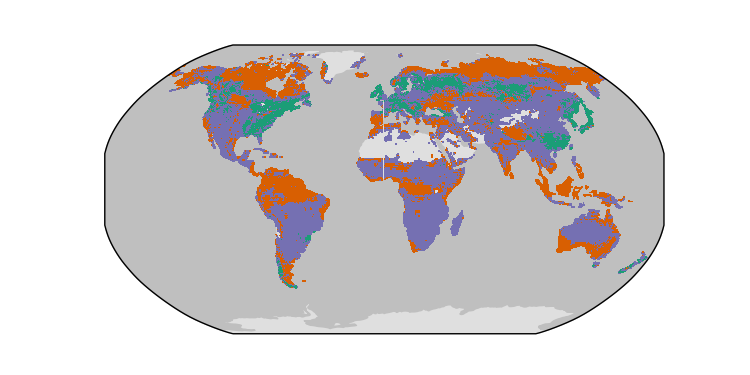
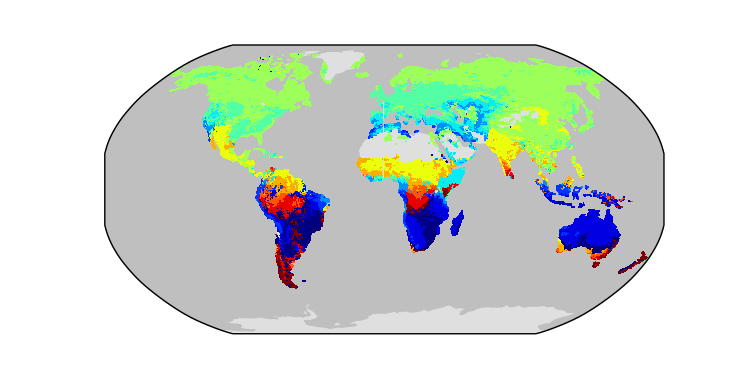
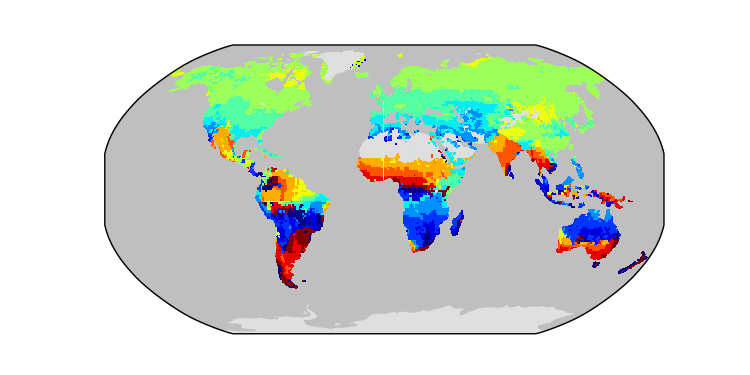
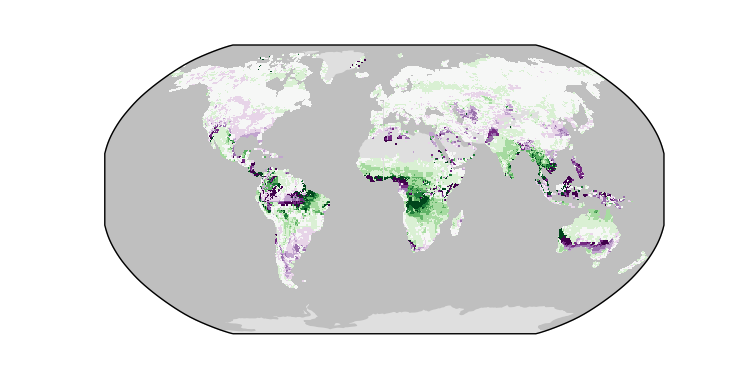
GrossPrimaryProductivity / FLUXCOM / 1980-2014 / global / Mean-Princeton
Global - Land
CLM-CRUJRA
Download Data |
Period Mean (original grids) [Pg yr-1] |
Model Period Mean (intersection) [Pg yr-1] |
Benchmark Period Mean (intersection) [Pg yr-1] |
Model Period Mean (complement) [Pg yr-1] |
Benchmark Period Mean (complement) [Pg yr-1] |
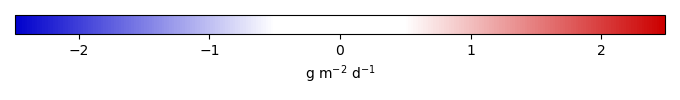
Bias [g m-2 d-1] |
RMSE [g m-2 d-1] |
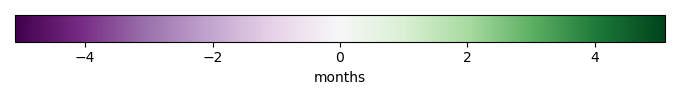
Phase Shift [months] |
Bias Score [1] |
RMSE Score [1] |
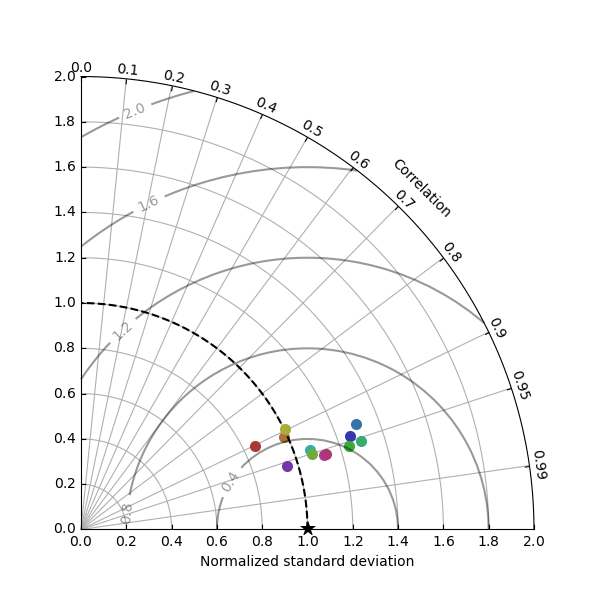
Seasonal Cycle Score [1] |
Spatial Distribution Score [1] |
Overall Score [1] |
|||
|---|---|---|---|---|---|---|---|---|---|---|---|---|---|---|---|---|
| Benchmark | [-] | 6.55 | ||||||||||||||
| CLM-CRUJRA | [-] | 13.9 | 13.5 | 6.54 | 0.405 | 0.0137 | 1.39 | 2.20 | 0.298 | 0.543 | 0.512 | 0.978 | 0.882 | 0.685 | ||
| CLM-GSWP3 | [-] | 12.3 | 12.0 | 6.54 | 0.365 | 0.0137 | 1.08 | 1.90 | 0.402 | 0.605 | 0.548 | 0.970 | 0.857 | 0.706 | ||
| CLM-Princeton | [-] | 16.9 | 16.4 | 6.54 | 0.491 | 0.0136 | 1.97 | 2.88 | 0.483 | 0.433 | 0.440 | 0.964 | 0.907 | 0.637 | ||
| ISBA-CTRIP-CRUJRA | [-] | 6.69 | 6.53 | 6.55 | 0.260 | 0.000553 | 0.000618 | 1.01 | 0.275 | 0.811 | 0.635 | 0.980 | 0.857 | 0.784 | ||
| ISBA-CTRIP-GSWP3 | [-] | 6.17 | 6.03 | 6.55 | 0.236 | 0.000553 | -0.0981 | 1.04 | 0.325 | 0.798 | 0.625 | 0.977 | 0.799 | 0.765 | ||
| ISBA-CTRIP-Princeton | [-] | 8.63 | 8.45 | 6.55 | 0.311 | 0.000554 | 0.388 | 1.13 | 0.226 | 0.796 | 0.630 | 0.984 | 0.952 | 0.798 | ||
| JSBACH-CRUJRA | [-] | 11.2 | 11.0 | 6.39 | 0.266 | 0.163 | 0.950 | 1.91 | 0.345 | 0.622 | 0.496 | 0.976 | 0.858 | 0.690 | ||
| JSBACH-GSWP3 | [-] | 10.5 | 10.4 | 6.39 | 0.245 | 0.163 | 0.828 | 1.51 | 0.287 | 0.682 | 0.582 | 0.981 | 0.958 | 0.757 | ||
| JSBACH-Princeton | [-] | 10.9 | 10.8 | 6.39 | 0.251 | 0.163 | 0.907 | 1.75 | 0.282 | 0.653 | 0.534 | 0.983 | 0.898 | 0.720 | ||
| Mean-CRUJRA | [-] | 10.6 | 10.4 | 6.55 | 0.391 | 0.779 | 1.42 | 0.188 | 0.693 | 0.610 | 0.988 | 0.967 | 0.774 | |||
| Mean-GSWP3 | [-] | 9.58 | 9.53 | 6.55 | 0.356 | 0.596 | 1.19 | 0.197 | 0.743 | 0.658 | 0.988 | 0.951 | 0.800 | |||
| Mean-Princeton | [-] | 12.1 | 12.0 | 6.55 | 0.446 | 1.09 | 1.67 | 0.162 | 0.625 | 0.587 | 0.990 | 0.968 | 0.751 |
Download Data |
Period Mean (original grids) [Pg yr-1] |
Model Period Mean (intersection) [Pg yr-1] |
Benchmark Period Mean (intersection) [Pg yr-1] |
Model Period Mean (complement) [Pg yr-1] |
Benchmark Period Mean (complement) [Pg yr-1] |
Bias [g m-2 d-1] |
RMSE [g m-2 d-1] |
Phase Shift [months] |
Bias Score [1] |
RMSE Score [1] |
Seasonal Cycle Score [1] |
Spatial Distribution Score [1] |
Overall Score [1] |
|||
|---|---|---|---|---|---|---|---|---|---|---|---|---|---|---|---|---|
| Benchmark | [-] | 114. | ||||||||||||||
| CLM-CRUJRA | [-] | 156. | 136. | 113. | 19.2 | 0.643 | 0.520 | 1.85 | 1.07 | 0.482 | 0.421 | 0.792 | 0.955 | 0.614 | ||
| CLM-GSWP3 | [-] | 136. | 117. | 113. | 17.5 | 0.643 | 0.0991 | 1.73 | 1.11 | 0.468 | 0.412 | 0.782 | 0.926 | 0.600 | ||
| CLM-Princeton | [-] | 168. | 149. | 113. | 19.7 | 0.642 | 0.826 | 2.08 | 1.05 | 0.477 | 0.414 | 0.802 | 0.948 | 0.611 | ||
| ISBA-CTRIP-CRUJRA | [-] | 164. | 135. | 114. | 27.1 | 0.0691 | 0.490 | 1.50 | 1.14 | 0.488 | 0.416 | 0.770 | 0.934 | 0.605 | ||
| ISBA-CTRIP-GSWP3 | [-] | 149. | 122. | 114. | 25.4 | 0.0691 | 0.190 | 1.49 | 1.39 | 0.566 | 0.357 | 0.693 | 0.970 | 0.589 | ||
| ISBA-CTRIP-Princeton | [-] | 183. | 152. | 114. | 29.1 | 0.0691 | 0.898 | 1.81 | 1.31 | 0.431 | 0.347 | 0.700 | 0.914 | 0.548 | ||
| JSBACH-CRUJRA | [-] | 142. | 135. | 104. | 8.72 | 9.83 | 0.753 | 2.06 | 1.12 | 0.410 | 0.332 | 0.778 | 0.904 | 0.551 | ||
| JSBACH-GSWP3 | [-] | 139. | 131. | 104. | 7.82 | 9.82 | 0.670 | 1.85 | 1.32 | 0.513 | 0.327 | 0.708 | 0.968 | 0.568 | ||
| JSBACH-Princeton | [-] | 140. | 133. | 104. | 7.86 | 9.82 | 0.722 | 1.97 | 1.24 | 0.430 | 0.326 | 0.721 | 0.924 | 0.545 | ||
| Mean-CRUJRA | [-] | 169. | 139. | 113. | 30.1 | 0.308 | 0.588 | 1.45 | 0.954 | 0.515 | 0.463 | 0.816 | 0.965 | 0.644 | ||
| Mean-GSWP3 | [-] | 155. | 127. | 113. | 27.8 | 0.308 | 0.314 | 1.37 | 1.12 | 0.573 | 0.424 | 0.762 | 0.976 | 0.632 | ||
| Mean-Princeton | [-] | 180. | 149. | 113. | 31.2 | 0.308 | 0.825 | 1.63 | 1.08 | 0.484 | 0.422 | 0.766 | 0.963 | 0.611 |
Download Data |
Period Mean (original grids) [Pg yr-1] |
Model Period Mean (intersection) [Pg yr-1] |
Benchmark Period Mean (intersection) [Pg yr-1] |
Model Period Mean (complement) [Pg yr-1] |
Benchmark Period Mean (complement) [Pg yr-1] |
Bias [g m-2 d-1] |
RMSE [g m-2 d-1] |
Phase Shift [months] |
Bias Score [1] |
RMSE Score [1] |
Seasonal Cycle Score [1] |
Spatial Distribution Score [1] |
Overall Score [1] |
|||
|---|---|---|---|---|---|---|---|---|---|---|---|---|---|---|---|---|
| Benchmark | [-] | 5.74 | ||||||||||||||
| CLM-CRUJRA | [-] | 7.88 | 7.12 | 5.71 | 0.552 | 0.0359 | 0.217 | 1.12 | 1.31 | 0.614 | 0.363 | 0.826 | 0.892 | 0.611 | ||
| CLM-GSWP3 | [-] | 7.15 | 6.65 | 5.71 | 0.418 | 0.0359 | 0.145 | 1.04 | 1.31 | 0.633 | 0.387 | 0.855 | 0.881 | 0.629 | ||
| CLM-Princeton | [-] | 7.76 | 7.11 | 5.71 | 0.485 | 0.0359 | 0.214 | 1.07 | 1.15 | 0.623 | 0.370 | 0.849 | 0.927 | 0.628 | ||
| ISBA-CTRIP-CRUJRA | [-] | 7.81 | 6.55 | 5.74 | 0.851 | 0.00521 | 0.134 | 0.985 | 1.53 | 0.616 | 0.399 | 0.852 | 0.905 | 0.634 | ||
| ISBA-CTRIP-GSWP3 | [-] | 7.27 | 6.19 | 5.74 | 0.722 | 0.00521 | 0.0803 | 1.05 | 1.89 | 0.620 | 0.369 | 0.815 | 0.919 | 0.619 | ||
| ISBA-CTRIP-Princeton | [-] | 8.90 | 7.55 | 5.74 | 0.880 | 0.00521 | 0.288 | 1.18 | 1.58 | 0.570 | 0.342 | 0.839 | 0.822 | 0.583 | ||
| JSBACH-CRUJRA | [-] | 5.88 | 5.54 | 5.46 | 0.368 | 0.279 | 0.0159 | 1.07 | 1.44 | 0.591 | 0.355 | 0.830 | 0.897 | 0.606 | ||
| JSBACH-GSWP3 | [-] | 7.11 | 6.60 | 5.46 | 0.528 | 0.279 | 0.184 | 1.13 | 1.50 | 0.617 | 0.337 | 0.827 | 0.917 | 0.607 | ||
| JSBACH-Princeton | [-] | 5.57 | 5.32 | 5.46 | 0.236 | 0.279 | -0.0176 | 1.06 | 1.33 | 0.601 | 0.348 | 0.835 | 0.892 | 0.605 | ||
| Mean-CRUJRA | [-] | 7.52 | 6.52 | 5.72 | 0.987 | 0.0242 | 0.121 | 0.851 | 1.32 | 0.663 | 0.443 | 0.862 | 0.938 | 0.670 | ||
| Mean-GSWP3 | [-] | 7.52 | 6.60 | 5.72 | 0.875 | 0.0242 | 0.133 | 0.899 | 1.46 | 0.672 | 0.422 | 0.858 | 0.924 | 0.659 | ||
| Mean-Princeton | [-] | 7.83 | 6.81 | 5.72 | 0.965 | 0.0242 | 0.165 | 0.890 | 1.34 | 0.660 | 0.419 | 0.855 | 0.945 | 0.660 |
Download Data |
Period Mean (original grids) [Pg yr-1] |
Model Period Mean (intersection) [Pg yr-1] |
Benchmark Period Mean (intersection) [Pg yr-1] |
Model Period Mean (complement) [Pg yr-1] |
Benchmark Period Mean (complement) [Pg yr-1] |
Bias [g m-2 d-1] |
RMSE [g m-2 d-1] |
Phase Shift [months] |
Bias Score [1] |
RMSE Score [1] |
Seasonal Cycle Score [1] |
Spatial Distribution Score [1] |
Overall Score [1] |
|||
|---|---|---|---|---|---|---|---|---|---|---|---|---|---|---|---|---|
| Benchmark | [-] | 1.28 | ||||||||||||||
| CLM-CRUJRA | [-] | 1.73 | 1.55 | 1.27 | 0.157 | 0.000726 | 0.120 | 0.902 | 1.06 | 0.543 | 0.320 | 0.900 | 0.817 | 0.580 | ||
| CLM-GSWP3 | [-] | 1.58 | 1.42 | 1.27 | 0.133 | 0.000726 | 0.0711 | 0.849 | 1.11 | 0.546 | 0.340 | 0.893 | 0.821 | 0.588 | ||
| CLM-Princeton | [-] | 1.89 | 1.69 | 1.27 | 0.171 | 0.000726 | 0.181 | 0.926 | 1.05 | 0.556 | 0.307 | 0.907 | 0.800 | 0.575 | ||
| ISBA-CTRIP-CRUJRA | [-] | 1.19 | 1.00 | 1.28 | 0.114 | -0.113 | 0.666 | 0.879 | 0.516 | 0.449 | 0.927 | 0.817 | 0.631 | |||
| ISBA-CTRIP-GSWP3 | [-] | 1.28 | 1.08 | 1.28 | 0.124 | -0.0794 | 0.709 | 1.06 | 0.513 | 0.431 | 0.893 | 0.776 | 0.609 | |||
| ISBA-CTRIP-Princeton | [-] | 1.42 | 1.22 | 1.28 | 0.125 | -0.0249 | 0.730 | 1.00 | 0.531 | 0.411 | 0.905 | 0.751 | 0.602 | |||
| JSBACH-CRUJRA | [-] | 0.863 | 0.766 | 1.23 | 0.0673 | 0.0499 | -0.197 | 0.727 | 1.02 | 0.523 | 0.374 | 0.912 | 0.793 | 0.595 | ||
| JSBACH-GSWP3 | [-] | 1.50 | 1.35 | 1.23 | 0.0822 | 0.0499 | 0.0470 | 0.830 | 1.09 | 0.600 | 0.333 | 0.906 | 0.838 | 0.602 | ||
| JSBACH-Princeton | [-] | 0.858 | 0.765 | 1.23 | 0.0446 | 0.0499 | -0.197 | 0.694 | 1.08 | 0.548 | 0.383 | 0.890 | 0.780 | 0.597 | ||
| Mean-CRUJRA | [-] | 1.26 | 1.10 | 1.27 | 0.136 | 0.00831 | -0.0682 | 0.639 | 0.838 | 0.567 | 0.442 | 0.934 | 0.865 | 0.650 | ||
| Mean-GSWP3 | [-] | 1.46 | 1.28 | 1.27 | 0.134 | 0.00831 | 0.00369 | 0.667 | 0.959 | 0.596 | 0.431 | 0.928 | 0.863 | 0.650 | ||
| Mean-Princeton | [-] | 1.41 | 1.22 | 1.27 | 0.136 | 0.00829 | -0.0186 | 0.646 | 0.909 | 0.593 | 0.429 | 0.928 | 0.879 | 0.652 |
Download Data |
Period Mean (original grids) [Pg yr-1] |
Model Period Mean (intersection) [Pg yr-1] |
Benchmark Period Mean (intersection) [Pg yr-1] |
Model Period Mean (complement) [Pg yr-1] |
Benchmark Period Mean (complement) [Pg yr-1] |
Bias [g m-2 d-1] |
RMSE [g m-2 d-1] |
Phase Shift [months] |
Bias Score [1] |
RMSE Score [1] |
Seasonal Cycle Score [1] |
Spatial Distribution Score [1] |
Overall Score [1] |
|||
|---|---|---|---|---|---|---|---|---|---|---|---|---|---|---|---|---|
| Benchmark | [-] | 0.710 | ||||||||||||||
| CLM-CRUJRA | [-] | 1.04 | 0.857 | 0.686 | 0.132 | 0.0240 | 0.948 | 1.84 | 1.02 | 0.472 | 0.430 | 0.854 | 0.968 | 0.631 | ||
| CLM-GSWP3 | [-] | 0.967 | 0.814 | 0.686 | 0.111 | 0.0240 | 0.735 | 1.63 | 1.19 | 0.471 | 0.449 | 0.811 | 0.977 | 0.632 | ||
| CLM-Princeton | [-] | 1.16 | 0.972 | 0.686 | 0.133 | 0.0240 | 1.59 | 2.24 | 1.11 | 0.376 | 0.423 | 0.844 | 0.976 | 0.608 | ||
| ISBA-CTRIP-CRUJRA | [-] | 0.792 | 0.748 | 0.709 | 0.122 | 0.000507 | 0.268 | 1.99 | 0.862 | 0.375 | 0.451 | 0.851 | 0.720 | 0.570 | ||
| ISBA-CTRIP-GSWP3 | [-] | 0.774 | 0.676 | 0.709 | 0.122 | 0.000507 | -0.112 | 1.78 | 1.22 | 0.400 | 0.416 | 0.746 | 0.831 | 0.562 | ||
| ISBA-CTRIP-Princeton | [-] | 0.949 | 0.813 | 0.709 | 0.150 | 0.000507 | 0.606 | 1.84 | 1.40 | 0.410 | 0.420 | 0.714 | 0.781 | 0.549 | ||
| JSBACH-CRUJRA | [-] | 1.15 | 0.839 | 0.542 | 0.0683 | 0.167 | 2.01 | 2.57 | 1.04 | 0.272 | 0.332 | 0.770 | 0.935 | 0.528 | ||
| JSBACH-GSWP3 | [-] | 0.966 | 0.707 | 0.542 | 0.0544 | 0.167 | 1.11 | 1.87 | 1.52 | 0.395 | 0.351 | 0.649 | 0.970 | 0.543 | ||
| JSBACH-Princeton | [-] | 1.08 | 0.803 | 0.542 | 0.0614 | 0.167 | 1.76 | 2.20 | 1.58 | 0.311 | 0.403 | 0.612 | 0.956 | 0.537 | ||
| Mean-CRUJRA | [-] | 1.24 | 0.866 | 0.707 | 0.157 | 0.00298 | 0.834 | 1.44 | 0.667 | 0.469 | 0.528 | 0.883 | 0.954 | 0.672 | ||
| Mean-GSWP3 | [-] | 1.13 | 0.785 | 0.707 | 0.147 | 0.00298 | 0.411 | 1.30 | 0.958 | 0.467 | 0.522 | 0.784 | 0.969 | 0.653 | ||
| Mean-Princeton | [-] | 1.32 | 0.924 | 0.707 | 0.178 | 0.00298 | 1.14 | 1.68 | 0.934 | 0.436 | 0.509 | 0.810 | 0.951 | 0.643 |
Download Data |
Period Mean (original grids) [Pg yr-1] |
Model Period Mean (intersection) [Pg yr-1] |
Benchmark Period Mean (intersection) [Pg yr-1] |
Model Period Mean (complement) [Pg yr-1] |
Benchmark Period Mean (complement) [Pg yr-1] |
Bias [g m-2 d-1] |
RMSE [g m-2 d-1] |
Phase Shift [months] |
Bias Score [1] |
RMSE Score [1] |
Seasonal Cycle Score [1] |
Spatial Distribution Score [1] |
Overall Score [1] |
|||
|---|---|---|---|---|---|---|---|---|---|---|---|---|---|---|---|---|
| Benchmark | [-] | 15.7 | ||||||||||||||
| CLM-CRUJRA | [-] | 20.5 | 18.9 | 15.6 | 1.48 | 0.109 | 0.620 | 1.69 | 0.424 | 0.716 | 0.627 | 0.959 | 0.953 | 0.776 | ||
| CLM-GSWP3 | [-] | 18.3 | 16.8 | 15.6 | 1.30 | 0.109 | 0.219 | 1.60 | 0.471 | 0.710 | 0.628 | 0.955 | 0.930 | 0.770 | ||
| CLM-Princeton | [-] | 22.7 | 20.9 | 15.6 | 1.53 | 0.109 | 1.00 | 1.96 | 0.488 | 0.669 | 0.608 | 0.955 | 0.951 | 0.758 | ||
| ISBA-CTRIP-CRUJRA | [-] | 17.0 | 15.5 | 15.7 | 1.41 | 0.00339 | -0.0291 | 1.62 | 0.626 | 0.698 | 0.605 | 0.945 | 0.938 | 0.758 | ||
| ISBA-CTRIP-GSWP3 | [-] | 16.5 | 15.0 | 15.7 | 1.38 | 0.00339 | -0.132 | 1.68 | 0.676 | 0.686 | 0.588 | 0.931 | 0.957 | 0.750 | ||
| ISBA-CTRIP-Princeton | [-] | 21.6 | 19.7 | 15.7 | 1.71 | 0.00339 | 0.766 | 1.90 | 0.690 | 0.652 | 0.589 | 0.935 | 0.869 | 0.727 | ||
| JSBACH-CRUJRA | [-] | 20.2 | 18.9 | 14.3 | 0.866 | 1.43 | 0.935 | 2.20 | 0.524 | 0.610 | 0.519 | 0.948 | 0.876 | 0.694 | ||
| JSBACH-GSWP3 | [-] | 20.3 | 19.0 | 14.3 | 0.810 | 1.43 | 0.969 | 1.95 | 0.617 | 0.677 | 0.570 | 0.930 | 0.972 | 0.744 | ||
| JSBACH-Princeton | [-] | 20.3 | 19.0 | 14.3 | 0.838 | 1.43 | 0.967 | 2.10 | 0.545 | 0.646 | 0.533 | 0.941 | 0.966 | 0.724 | ||
| Mean-CRUJRA | [-] | 19.7 | 18.2 | 15.6 | 1.67 | 0.0417 | 0.482 | 1.40 | 0.414 | 0.728 | 0.663 | 0.962 | 0.982 | 0.799 | ||
| Mean-GSWP3 | [-] | 18.8 | 17.3 | 15.6 | 1.56 | 0.0417 | 0.319 | 1.37 | 0.455 | 0.738 | 0.663 | 0.958 | 0.941 | 0.793 | ||
| Mean-Princeton | [-] | 22.1 | 20.4 | 15.6 | 1.83 | 0.0417 | 0.895 | 1.65 | 0.455 | 0.685 | 0.642 | 0.956 | 0.981 | 0.781 |
Download Data |
Period Mean (original grids) [Pg yr-1] |
Model Period Mean (intersection) [Pg yr-1] |
Benchmark Period Mean (intersection) [Pg yr-1] |
Model Period Mean (complement) [Pg yr-1] |
Benchmark Period Mean (complement) [Pg yr-1] |
Bias [g m-2 d-1] |
RMSE [g m-2 d-1] |
Phase Shift [months] |
Bias Score [1] |
RMSE Score [1] |
Seasonal Cycle Score [1] |
Spatial Distribution Score [1] |
Overall Score [1] |
|||
|---|---|---|---|---|---|---|---|---|---|---|---|---|---|---|---|---|
| Benchmark | [-] | 12.4 | ||||||||||||||
| CLM-CRUJRA | [-] | 13.0 | 11.7 | 12.1 | 0.981 | 0.272 | -0.242 | 1.33 | 2.41 | 0.257 | 0.299 | 0.633 | 0.737 | 0.445 | ||
| CLM-GSWP3 | [-] | 11.8 | 10.6 | 12.1 | 0.918 | 0.272 | -0.921 | 1.77 | 2.98 | 0.131 | 0.241 | 0.512 | 0.750 | 0.375 | ||
| CLM-Princeton | [-] | 13.4 | 12.1 | 12.1 | 1.01 | 0.272 | 0.0117 | 1.27 | 2.62 | 0.302 | 0.296 | 0.583 | 0.783 | 0.452 | ||
| ISBA-CTRIP-CRUJRA | [-] | 17.8 | 15.6 | 12.4 | 2.09 | 0.00674 | 2.00 | 2.25 | 2.33 | 0.0828 | 0.268 | 0.625 | 0.932 | 0.435 | ||
| ISBA-CTRIP-GSWP3 | [-] | 15.8 | 13.8 | 12.4 | 1.96 | 0.00674 | 0.892 | 1.69 | 2.77 | 0.303 | 0.138 | 0.548 | 0.967 | 0.419 | ||
| ISBA-CTRIP-Princeton | [-] | 17.4 | 15.2 | 12.4 | 2.10 | 0.00673 | 1.76 | 2.26 | 2.99 | 0.0966 | 0.115 | 0.511 | 0.948 | 0.357 | ||
| JSBACH-CRUJRA | [-] | 16.1 | 14.4 | 10.3 | 0.561 | 2.08 | 3.01 | 3.21 | 2.26 | 0.0273 | 0.260 | 0.634 | 0.869 | 0.410 | ||
| JSBACH-GSWP3 | [-] | 13.1 | 11.7 | 10.3 | 0.464 | 2.08 | 1.05 | 1.73 | 2.69 | 0.240 | 0.149 | 0.576 | 0.826 | 0.388 | ||
| JSBACH-Princeton | [-] | 15.0 | 13.4 | 10.3 | 0.517 | 2.08 | 2.24 | 2.47 | 2.70 | 0.0547 | 0.232 | 0.573 | 0.758 | 0.370 | ||
| Mean-CRUJRA | [-] | 16.3 | 14.8 | 12.4 | 2.00 | 1.48 | 1.66 | 1.80 | 0.158 | 0.377 | 0.723 | 0.697 | 0.467 | |||
| Mean-GSWP3 | [-] | 14.4 | 12.9 | 12.4 | 1.86 | 0.314 | 1.16 | 2.12 | 0.385 | 0.269 | 0.674 | 0.730 | 0.465 | |||
| Mean-Princeton | [-] | 16.1 | 14.5 | 12.4 | 2.01 | 1.30 | 1.58 | 2.41 | 0.188 | 0.274 | 0.620 | 0.734 | 0.418 |
Download Data |
Period Mean (original grids) [Pg yr-1] |
Model Period Mean (intersection) [Pg yr-1] |
Benchmark Period Mean (intersection) [Pg yr-1] |
Model Period Mean (complement) [Pg yr-1] |
Benchmark Period Mean (complement) [Pg yr-1] |
Bias [g m-2 d-1] |
RMSE [g m-2 d-1] |
Phase Shift [months] |
Bias Score [1] |
RMSE Score [1] |
Seasonal Cycle Score [1] |
Spatial Distribution Score [1] |
Overall Score [1] |
|||
|---|---|---|---|---|---|---|---|---|---|---|---|---|---|---|---|---|
| Benchmark | [-] | 60.7 | ||||||||||||||
| CLM-CRUJRA | [-] | 69.0 | 63.1 | 60.1 | 5.20 | 0.595 | 0.244 | 2.35 | 1.86 | 0.425 | 0.396 | 0.725 | 0.911 | 0.570 | ||
| CLM-GSWP3 | [-] | 57.8 | 52.3 | 60.1 | 4.82 | 0.595 | -0.650 | 2.29 | 1.78 | 0.409 | 0.376 | 0.730 | 0.960 | 0.570 | ||
| CLM-Princeton | [-] | 72.2 | 66.2 | 60.1 | 5.33 | 0.595 | 0.495 | 2.34 | 1.69 | 0.441 | 0.403 | 0.754 | 0.899 | 0.580 | ||
| ISBA-CTRIP-CRUJRA | [-] | 84.5 | 76.5 | 60.6 | 8.89 | 0.0700 | 1.31 | 2.45 | 2.00 | 0.428 | 0.349 | 0.685 | 0.952 | 0.553 | ||
| ISBA-CTRIP-GSWP3 | [-] | 73.0 | 66.0 | 60.6 | 8.08 | 0.0700 | 0.446 | 2.36 | 2.54 | 0.538 | 0.278 | 0.567 | 0.981 | 0.528 | ||
| ISBA-CTRIP-Princeton | [-] | 91.4 | 83.1 | 60.6 | 9.42 | 0.0700 | 1.85 | 3.01 | 2.44 | 0.353 | 0.275 | 0.584 | 0.945 | 0.486 | ||
| JSBACH-CRUJRA | [-] | 71.4 | 69.4 | 55.0 | 2.22 | 5.72 | 1.30 | 3.23 | 1.91 | 0.343 | 0.262 | 0.701 | 0.847 | 0.483 | ||
| JSBACH-GSWP3 | [-] | 66.1 | 64.4 | 55.0 | 1.89 | 5.71 | 0.847 | 2.78 | 2.47 | 0.468 | 0.254 | 0.586 | 0.977 | 0.508 | ||
| JSBACH-Princeton | [-] | 70.9 | 69.2 | 55.0 | 2.03 | 5.71 | 1.28 | 3.13 | 2.35 | 0.360 | 0.248 | 0.606 | 0.877 | 0.468 | ||
| Mean-CRUJRA | [-] | 81.5 | 72.2 | 60.5 | 8.62 | 0.187 | 0.965 | 2.14 | 1.69 | 0.464 | 0.405 | 0.744 | 0.952 | 0.594 | ||
| Mean-GSWP3 | [-] | 71.8 | 63.2 | 60.5 | 7.86 | 0.187 | 0.223 | 2.00 | 2.09 | 0.518 | 0.352 | 0.657 | 0.984 | 0.572 | ||
| Mean-Princeton | [-] | 85.2 | 75.5 | 60.5 | 8.95 | 0.187 | 1.24 | 2.31 | 2.01 | 0.429 | 0.369 | 0.675 | 0.954 | 0.559 |
Download Data |
Period Mean (original grids) [Pg yr-1] |
Model Period Mean (intersection) [Pg yr-1] |
Benchmark Period Mean (intersection) [Pg yr-1] |
Model Period Mean (complement) [Pg yr-1] |
Benchmark Period Mean (complement) [Pg yr-1] |
Bias [g m-2 d-1] |
RMSE [g m-2 d-1] |
Phase Shift [months] |
Bias Score [1] |
RMSE Score [1] |
Seasonal Cycle Score [1] |
Spatial Distribution Score [1] |
Overall Score [1] |
|||
|---|---|---|---|---|---|---|---|---|---|---|---|---|---|---|---|---|
| Benchmark | [-] | 2.00 | ||||||||||||||
| CLM-CRUJRA | [-] | 5.95 | 7.20 | 2.00 | 0.317 | 0.00124 | 1.21 | 2.34 | 0.297 | 0.408 | 0.286 | 0.985 | 0.426 | 0.478 | ||
| CLM-GSWP3 | [-] | 5.11 | 5.73 | 2.00 | 0.216 | 0.00124 | 0.863 | 1.88 | 0.381 | 0.529 | 0.380 | 0.973 | 0.435 | 0.539 | ||
| CLM-Princeton | [-] | 8.53 | 9.98 | 2.00 | 0.448 | 0.00124 | 1.85 | 3.30 | 0.344 | 0.260 | 0.182 | 0.971 | 0.344 | 0.388 | ||
| ISBA-CTRIP-CRUJRA | [-] | 3.32 | 3.20 | 2.00 | 0.139 | 6.78e-05 | 0.279 | 0.721 | 0.173 | 0.790 | 0.584 | 0.991 | 0.942 | 0.778 | ||
| ISBA-CTRIP-GSWP3 | [-] | 3.10 | 2.99 | 2.00 | 0.127 | 6.78e-05 | 0.229 | 0.695 | 0.197 | 0.805 | 0.589 | 0.989 | 0.938 | 0.782 | ||
| ISBA-CTRIP-Princeton | [-] | 4.29 | 4.17 | 2.00 | 0.154 | 6.75e-05 | 0.502 | 0.957 | 0.128 | 0.659 | 0.518 | 0.994 | 0.824 | 0.703 | ||
| JSBACH-CRUJRA | [-] | 3.12 | 5.48 | 1.96 | 0.240 | 0.0396 | 0.859 | 1.68 | 0.415 | 0.545 | 0.369 | 0.979 | 0.748 | 0.602 | ||
| JSBACH-GSWP3 | [-] | 4.04 | 5.13 | 1.96 | 0.194 | 0.0396 | 0.769 | 1.56 | 0.504 | 0.597 | 0.393 | 0.971 | 0.823 | 0.636 | ||
| JSBACH-Princeton | [-] | 3.43 | 5.08 | 1.96 | 0.214 | 0.0396 | 0.760 | 1.63 | 0.550 | 0.578 | 0.361 | 0.975 | 0.792 | 0.613 | ||
| Mean-CRUJRA | [-] | 5.45 | 5.34 | 2.00 | 0.276 | 5.56e-05 | 0.770 | 1.39 | 0.210 | 0.570 | 0.441 | 0.992 | 0.788 | 0.646 | ||
| Mean-GSWP3 | [-] | 4.73 | 4.65 | 2.00 | 0.222 | 5.56e-05 | 0.611 | 1.20 | 0.224 | 0.654 | 0.490 | 0.991 | 0.842 | 0.694 | ||
| Mean-Princeton | [-] | 6.63 | 6.48 | 2.00 | 0.333 | 5.54e-05 | 1.03 | 1.78 | 0.171 | 0.457 | 0.352 | 0.994 | 0.690 | 0.569 |
Download Data |
Period Mean (original grids) [Pg yr-1] |
Model Period Mean (intersection) [Pg yr-1] |
Benchmark Period Mean (intersection) [Pg yr-1] |
Model Period Mean (complement) [Pg yr-1] |
Benchmark Period Mean (complement) [Pg yr-1] |
Bias [g m-2 d-1] |
RMSE [g m-2 d-1] |
Phase Shift [months] |
Bias Score [1] |
RMSE Score [1] |
Seasonal Cycle Score [1] |
Spatial Distribution Score [1] |
Overall Score [1] |
|||
|---|---|---|---|---|---|---|---|---|---|---|---|---|---|---|---|---|
| Benchmark | [-] | 9.46 | ||||||||||||||
| CLM-CRUJRA | [-] | 13.0 | 12.1 | 9.41 | 0.737 | 0.0571 | 0.454 | 1.69 | 0.659 | 0.626 | 0.404 | 0.937 | 0.954 | 0.665 | ||
| CLM-GSWP3 | [-] | 12.3 | 11.4 | 9.41 | 0.686 | 0.0571 | 0.337 | 1.57 | 0.691 | 0.658 | 0.435 | 0.931 | 0.940 | 0.680 | ||
| CLM-Princeton | [-] | 15.1 | 14.0 | 9.40 | 0.797 | 0.0571 | 0.775 | 1.94 | 0.677 | 0.598 | 0.378 | 0.934 | 0.952 | 0.648 | ||
| ISBA-CTRIP-CRUJRA | [-] | 11.0 | 10.1 | 9.46 | 0.734 | 0.00322 | 0.101 | 1.11 | 0.625 | 0.662 | 0.535 | 0.944 | 0.942 | 0.724 | ||
| ISBA-CTRIP-GSWP3 | [-] | 11.9 | 10.9 | 9.46 | 0.756 | 0.00322 | 0.234 | 1.25 | 0.690 | 0.643 | 0.503 | 0.930 | 0.935 | 0.703 | ||
| ISBA-CTRIP-Princeton | [-] | 14.5 | 13.3 | 9.46 | 0.898 | 0.00322 | 0.641 | 1.51 | 0.695 | 0.583 | 0.459 | 0.930 | 0.850 | 0.656 | ||
| JSBACH-CRUJRA | [-] | 8.95 | 8.46 | 8.78 | 0.247 | 0.680 | -0.0547 | 1.46 | 0.682 | 0.650 | 0.402 | 0.919 | 0.939 | 0.662 | ||
| JSBACH-GSWP3 | [-] | 12.3 | 12.0 | 8.78 | 0.259 | 0.680 | 0.561 | 1.71 | 0.712 | 0.632 | 0.396 | 0.906 | 0.950 | 0.656 | ||
| JSBACH-Princeton | [-] | 9.52 | 9.09 | 8.78 | 0.223 | 0.680 | 0.0578 | 1.49 | 0.633 | 0.642 | 0.408 | 0.925 | 0.927 | 0.662 | ||
| Mean-CRUJRA | [-] | 11.3 | 10.4 | 9.39 | 0.822 | 0.0739 | 0.173 | 1.12 | 0.551 | 0.702 | 0.518 | 0.948 | 0.969 | 0.731 | ||
| Mean-GSWP3 | [-] | 12.5 | 11.6 | 9.39 | 0.814 | 0.0739 | 0.375 | 1.26 | 0.601 | 0.684 | 0.503 | 0.936 | 0.961 | 0.717 | ||
| Mean-Princeton | [-] | 13.4 | 12.4 | 9.39 | 0.935 | 0.0738 | 0.501 | 1.34 | 0.567 | 0.656 | 0.482 | 0.943 | 0.957 | 0.704 |
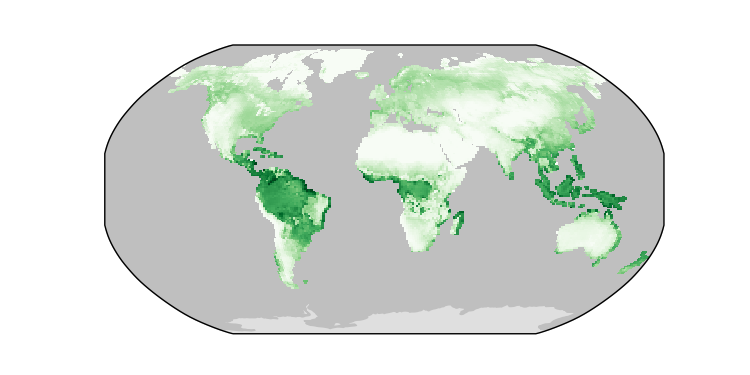
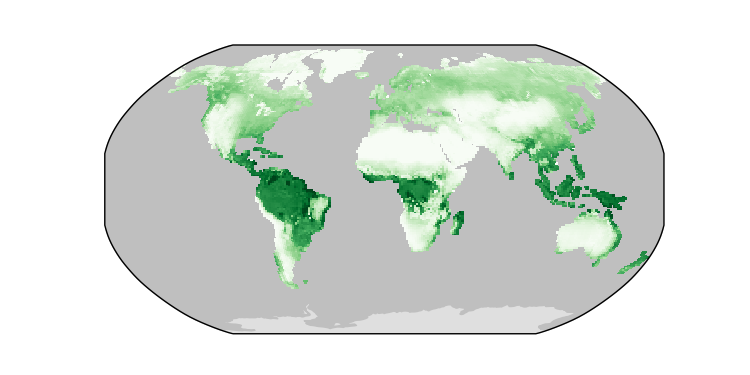
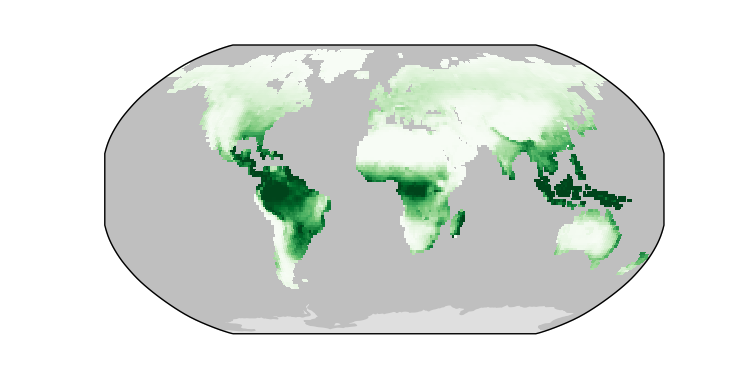
Temporally integrated period mean click to collapse contents


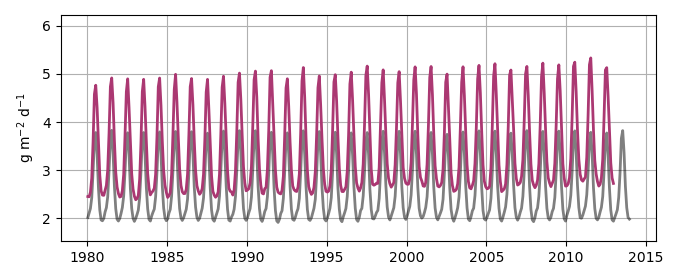
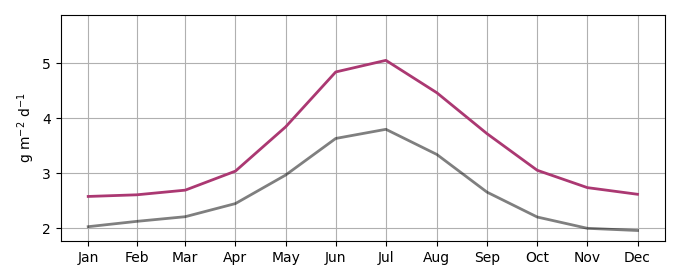
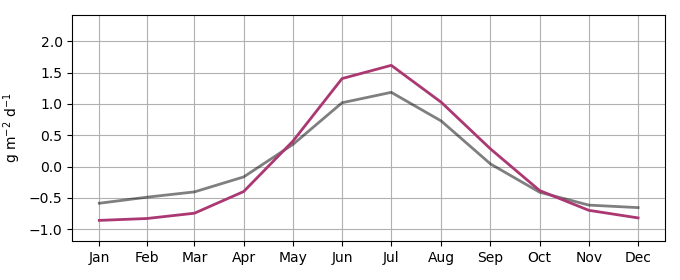
Spatially integrated regional mean click to collapse contents