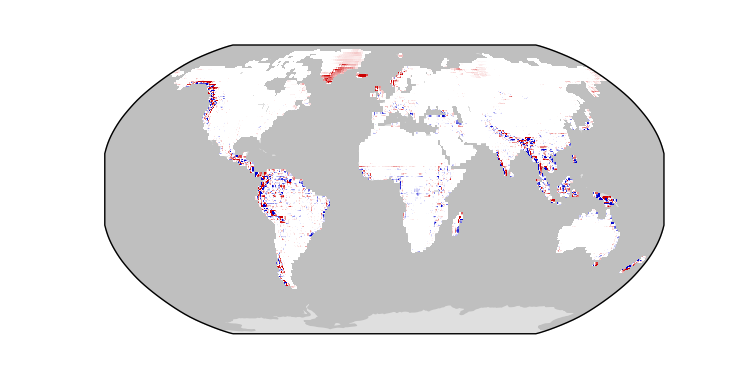
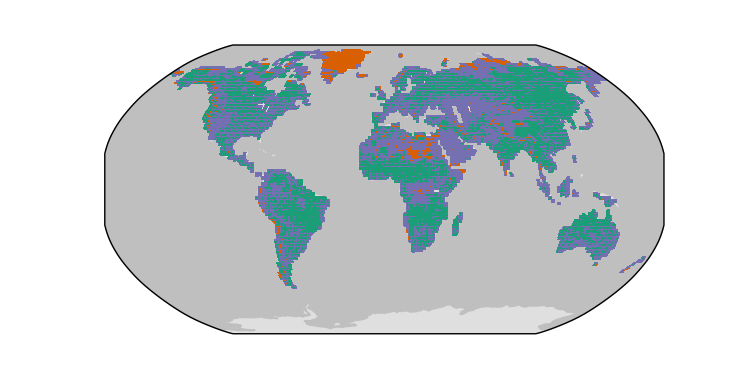
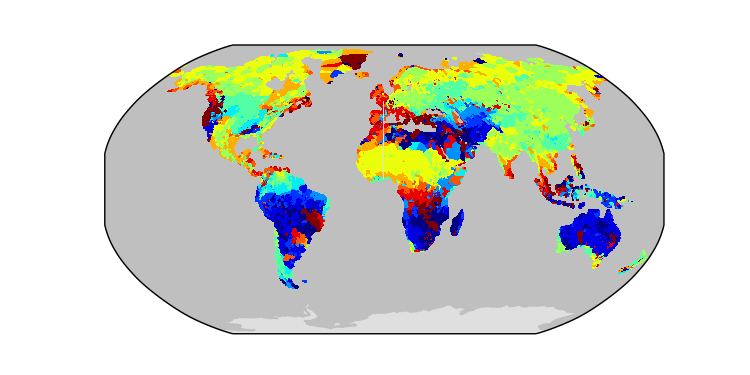
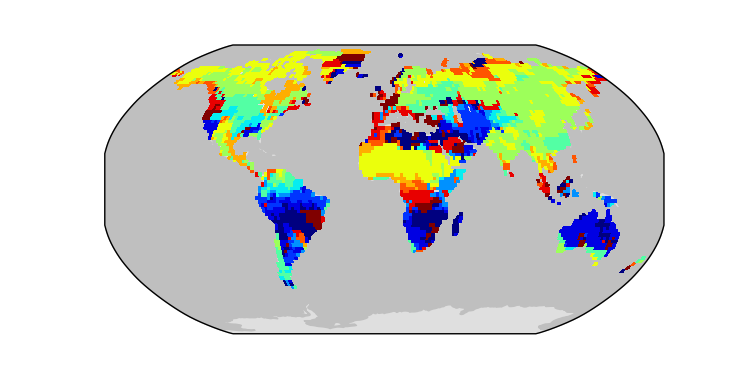
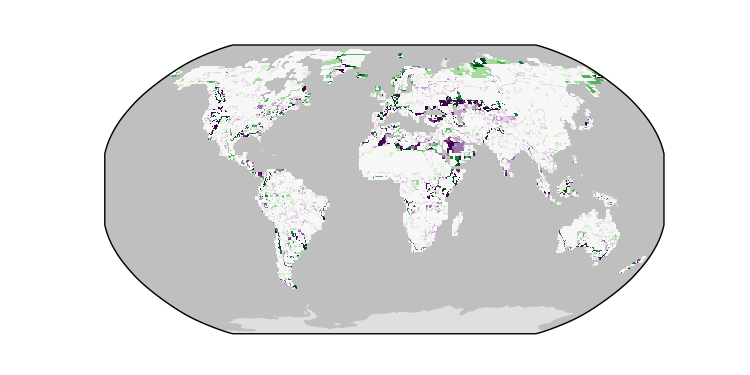
Precipitation / GPCCv2018 / 1980-2017 / global / JSBACH-GSWP3
Global - Land
CLM-CRUJRA
Download Data |
Period Mean (original grids) [mm d-1] |
Model Period Mean (intersection) [mm d-1] |
Benchmark Period Mean (intersection) [mm d-1] |
Model Period Mean (complement) [mm d-1] |
Benchmark Period Mean (complement) [mm d-1] |
Bias [mm d-1] |
RMSE [mm d-1] |
Phase Shift [months] |
Bias Score [1] |
RMSE Score [1] |
Seasonal Cycle Score [1] |
Spatial Distribution Score [1] |
Overall Score [1] |
|||
|---|---|---|---|---|---|---|---|---|---|---|---|---|---|---|---|---|
| Benchmark | [-] | 1.62 | ||||||||||||||
| CLM-CRUJRA | [-] | 1.66 | 1.67 | 1.62 | 1.02 | 2.29 | 0.0514 | 0.800 | 0.613 | 0.817 | 0.534 | 0.920 | 0.962 | 0.753 | ||
| CLM-GSWP3 | [-] | 1.74 | 1.76 | 1.60 | 1.13 | 2.29 | 0.162 | 0.535 | 0.421 | 0.826 | 0.667 | 0.938 | 0.949 | 0.810 | ||
| CLM-Princeton | [-] | 1.62 | 1.63 | 1.59 | 1.01 | 2.28 | 0.0338 | 0.719 | 0.482 | 0.821 | 0.573 | 0.933 | 0.964 | 0.773 | ||
| ISBA-CTRIP-CRUJRA | [-] | 1.67 | 1.67 | 1.60 | 1.09 | 2.12 | 0.0645 | 0.721 | 0.525 | 0.818 | 0.570 | 0.925 | 0.953 | 0.767 | ||
| ISBA-CTRIP-GSWP3 | [-] | 1.75 | 1.76 | 1.60 | 1.44 | 2.12 | 0.154 | 0.569 | 0.481 | 0.804 | 0.663 | 0.928 | 0.966 | 0.805 | ||
| ISBA-CTRIP-Princeton | [-] | 1.62 | 1.62 | 1.60 | 1.04 | 2.12 | 0.0185 | 0.740 | 0.520 | 0.815 | 0.563 | 0.921 | 0.954 | 0.763 | ||
| JSBACH-CRUJRA | [-] | 1.64 | 1.64 | 1.58 | 1.15 | 1.98 | 0.0601 | 0.716 | 0.490 | 0.824 | 0.575 | 0.931 | 0.963 | 0.773 | ||
| JSBACH-GSWP3 | [-] | 1.77 | 1.76 | 1.58 | 1.23 | 1.98 | 0.182 | 0.552 | 0.446 | 0.813 | 0.674 | 0.935 | 0.947 | 0.809 | ||
| JSBACH-Princeton | [-] | 1.61 | 1.61 | 1.58 | 1.08 | 1.98 | 0.0275 | 0.758 | 0.484 | 0.822 | 0.549 | 0.932 | 0.964 | 0.763 | ||
| Mean-CRUJRA | [-] | 1.65 | 1.68 | 1.62 | 1.11 | 2.76 | 0.0610 | 0.726 | 0.577 | 0.817 | 0.572 | 0.923 | 0.944 | 0.766 | ||
| Mean-GSWP3 | [-] | 1.73 | 1.77 | 1.60 | 1.31 | 2.73 | 0.167 | 0.487 | 0.403 | 0.821 | 0.705 | 0.940 | 0.985 | 0.831 | ||
| Mean-Princeton | [-] | 1.59 | 1.62 | 1.60 | 1.06 | 2.73 | 0.0258 | 0.710 | 0.481 | 0.823 | 0.577 | 0.930 | 0.949 | 0.771 |
Download Data |
Period Mean (original grids) [mm d-1] |
Model Period Mean (intersection) [mm d-1] |
Benchmark Period Mean (intersection) [mm d-1] |
Model Period Mean (complement) [mm d-1] |
Benchmark Period Mean (complement) [mm d-1] |
Bias [mm d-1] |
RMSE [mm d-1] |
Phase Shift [months] |
Bias Score [1] |
RMSE Score [1] |
Seasonal Cycle Score [1] |
Spatial Distribution Score [1] |
Overall Score [1] |
|||
|---|---|---|---|---|---|---|---|---|---|---|---|---|---|---|---|---|
| Benchmark | [-] | 2.28 | ||||||||||||||
| CLM-CRUJRA | [-] | 2.39 | 2.27 | 2.25 | 3.06 | 3.92 | 0.0189 | 1.23 | 0.814 | 0.829 | 0.531 | 0.898 | 0.983 | 0.755 | ||
| CLM-GSWP3 | [-] | 2.38 | 2.31 | 2.23 | 2.80 | 3.88 | 0.0767 | 0.796 | 0.546 | 0.857 | 0.672 | 0.932 | 0.988 | 0.824 | ||
| CLM-Princeton | [-] | 2.31 | 2.20 | 2.23 | 2.68 | 3.89 | -0.0294 | 1.14 | 0.723 | 0.833 | 0.558 | 0.908 | 0.981 | 0.768 | ||
| ISBA-CTRIP-CRUJRA | [-] | 2.32 | 2.26 | 2.25 | 3.08 | 4.12 | 0.0142 | 1.13 | 0.722 | 0.831 | 0.565 | 0.906 | 0.980 | 0.769 | ||
| ISBA-CTRIP-GSWP3 | [-] | 2.35 | 2.31 | 2.25 | 2.92 | 4.12 | 0.0624 | 0.893 | 0.613 | 0.835 | 0.653 | 0.917 | 0.981 | 0.808 | ||
| ISBA-CTRIP-Princeton | [-] | 2.25 | 2.21 | 2.25 | 2.78 | 4.12 | -0.0368 | 1.21 | 0.750 | 0.821 | 0.543 | 0.901 | 0.977 | 0.757 | ||
| JSBACH-CRUJRA | [-] | 2.22 | 2.14 | 2.13 | 3.14 | 3.47 | 0.0123 | 1.09 | 0.719 | 0.832 | 0.564 | 0.915 | 0.977 | 0.770 | ||
| JSBACH-GSWP3 | [-] | 2.25 | 2.20 | 2.13 | 3.07 | 3.47 | 0.0744 | 0.808 | 0.575 | 0.841 | 0.665 | 0.929 | 0.983 | 0.817 | ||
| JSBACH-Princeton | [-] | 2.17 | 2.10 | 2.13 | 2.93 | 3.47 | -0.0290 | 1.13 | 0.715 | 0.830 | 0.549 | 0.914 | 0.977 | 0.764 | ||
| Mean-CRUJRA | [-] | 2.35 | 2.30 | 2.28 | 3.21 | 2.33 | 0.0128 | 1.13 | 0.755 | 0.834 | 0.567 | 0.903 | 0.982 | 0.770 | ||
| Mean-GSWP3 | [-] | 2.36 | 2.32 | 2.26 | 3.01 | 2.29 | 0.0645 | 0.748 | 0.500 | 0.860 | 0.697 | 0.938 | 0.988 | 0.836 | ||
| Mean-Princeton | [-] | 2.26 | 2.22 | 2.26 | 2.84 | 2.29 | -0.0373 | 1.13 | 0.697 | 0.836 | 0.564 | 0.912 | 0.980 | 0.771 |
Download Data |
Period Mean (original grids) [mm d-1] |
Model Period Mean (intersection) [mm d-1] |
Benchmark Period Mean (intersection) [mm d-1] |
Model Period Mean (complement) [mm d-1] |
Benchmark Period Mean (complement) [mm d-1] |
Bias [mm d-1] |
RMSE [mm d-1] |
Phase Shift [months] |
Bias Score [1] |
RMSE Score [1] |
Seasonal Cycle Score [1] |
Spatial Distribution Score [1] |
Overall Score [1] |
|||
|---|---|---|---|---|---|---|---|---|---|---|---|---|---|---|---|---|
| Benchmark | [-] | 0.663 | ||||||||||||||
| CLM-CRUJRA | [-] | 0.674 | 0.669 | 0.648 | 1.16 | 1.43 | 0.0241 | 0.648 | 1.03 | 0.886 | 0.545 | 0.917 | 0.983 | 0.775 | ||
| CLM-GSWP3 | [-] | 0.647 | 0.641 | 0.635 | 1.01 | 1.48 | 0.00759 | 0.429 | 0.607 | 0.906 | 0.669 | 0.947 | 0.983 | 0.835 | ||
| CLM-Princeton | [-] | 0.604 | 0.600 | 0.636 | 1.09 | 1.49 | -0.0339 | 0.606 | 0.903 | 0.882 | 0.564 | 0.922 | 0.982 | 0.783 | ||
| ISBA-CTRIP-CRUJRA | [-] | 0.693 | 0.677 | 0.647 | 1.91 | 1.37 | 0.0348 | 0.617 | 0.940 | 0.876 | 0.566 | 0.924 | 0.973 | 0.781 | ||
| ISBA-CTRIP-GSWP3 | [-] | 0.674 | 0.655 | 0.647 | 1.85 | 1.37 | 0.0140 | 0.466 | 0.656 | 0.882 | 0.651 | 0.936 | 0.972 | 0.819 | ||
| ISBA-CTRIP-Princeton | [-] | 0.640 | 0.620 | 0.648 | 1.92 | 1.37 | -0.0220 | 0.650 | 0.900 | 0.865 | 0.545 | 0.921 | 0.968 | 0.769 | ||
| JSBACH-CRUJRA | [-] | 0.667 | 0.671 | 0.630 | 1.24 | 0.918 | 0.0426 | 0.598 | 0.932 | 0.876 | 0.572 | 0.928 | 0.979 | 0.785 | ||
| JSBACH-GSWP3 | [-] | 0.648 | 0.653 | 0.630 | 1.30 | 0.918 | 0.0248 | 0.434 | 0.636 | 0.887 | 0.666 | 0.941 | 0.975 | 0.827 | ||
| JSBACH-Princeton | [-] | 0.603 | 0.607 | 0.630 | 1.21 | 0.918 | -0.0207 | 0.617 | 0.877 | 0.872 | 0.555 | 0.924 | 0.979 | 0.777 | ||
| Mean-CRUJRA | [-] | 0.700 | 0.694 | 0.661 | 1.88 | 0.815 | 0.0331 | 0.605 | 0.980 | 0.885 | 0.572 | 0.919 | 0.977 | 0.785 | ||
| Mean-GSWP3 | [-] | 0.667 | 0.661 | 0.649 | 1.80 | 0.809 | 0.0124 | 0.394 | 0.563 | 0.905 | 0.695 | 0.950 | 0.986 | 0.846 | ||
| Mean-Princeton | [-] | 0.631 | 0.626 | 0.649 | 1.89 | 0.810 | -0.0233 | 0.601 | 0.870 | 0.884 | 0.571 | 0.925 | 0.978 | 0.786 |
Download Data |
Period Mean (original grids) [mm d-1] |
Model Period Mean (intersection) [mm d-1] |
Benchmark Period Mean (intersection) [mm d-1] |
Model Period Mean (complement) [mm d-1] |
Benchmark Period Mean (complement) [mm d-1] |
Bias [mm d-1] |
RMSE [mm d-1] |
Phase Shift [months] |
Bias Score [1] |
RMSE Score [1] |
Seasonal Cycle Score [1] |
Spatial Distribution Score [1] |
Overall Score [1] |
|||
|---|---|---|---|---|---|---|---|---|---|---|---|---|---|---|---|---|
| Benchmark | [-] | 0.532 | ||||||||||||||
| CLM-CRUJRA | [-] | 0.599 | 0.596 | 0.532 | 0.650 | 1.74 | 0.0696 | 0.475 | 1.05 | 0.798 | 0.501 | 0.856 | 0.963 | 0.724 | ||
| CLM-GSWP3 | [-] | 0.564 | 0.562 | 0.539 | 0.575 | 1.76 | 0.0317 | 0.331 | 0.779 | 0.840 | 0.609 | 0.894 | 0.967 | 0.784 | ||
| CLM-Princeton | [-] | 0.565 | 0.562 | 0.536 | 0.609 | 1.79 | 0.0302 | 0.449 | 0.987 | 0.817 | 0.522 | 0.854 | 0.974 | 0.738 | ||
| ISBA-CTRIP-CRUJRA | [-] | 0.620 | 0.616 | 0.541 | 0.952 | 1.27 | 0.0750 | 0.434 | 0.891 | 0.793 | 0.549 | 0.873 | 0.953 | 0.744 | ||
| ISBA-CTRIP-GSWP3 | [-] | 0.586 | 0.573 | 0.541 | 0.694 | 1.27 | 0.0316 | 0.353 | 0.861 | 0.819 | 0.600 | 0.877 | 0.962 | 0.772 | ||
| ISBA-CTRIP-Princeton | [-] | 0.573 | 0.568 | 0.540 | 0.730 | 1.29 | 0.0268 | 0.468 | 0.984 | 0.801 | 0.512 | 0.855 | 0.962 | 0.728 | ||
| JSBACH-CRUJRA | [-] | 0.620 | 0.616 | 0.530 | 0.432 | 0.883 | 0.0834 | 0.442 | 0.985 | 0.791 | 0.544 | 0.862 | 0.950 | 0.738 | ||
| JSBACH-GSWP3 | [-] | 0.581 | 0.571 | 0.530 | 0.351 | 0.883 | 0.0373 | 0.337 | 0.791 | 0.816 | 0.612 | 0.887 | 0.971 | 0.780 | ||
| JSBACH-Princeton | [-] | 0.572 | 0.567 | 0.530 | 0.394 | 0.883 | 0.0337 | 0.464 | 0.962 | 0.806 | 0.506 | 0.857 | 0.959 | 0.727 | ||
| Mean-CRUJRA | [-] | 0.607 | 0.597 | 0.530 | 0.956 | 1.01 | 0.0667 | 0.425 | 0.930 | 0.794 | 0.549 | 0.871 | 0.919 | 0.736 | ||
| Mean-GSWP3 | [-] | 0.580 | 0.566 | 0.540 | 0.713 | 0.988 | 0.0263 | 0.297 | 0.725 | 0.846 | 0.647 | 0.902 | 0.984 | 0.805 | ||
| Mean-Princeton | [-] | 0.575 | 0.562 | 0.539 | 0.741 | 0.994 | 0.0231 | 0.434 | 0.968 | 0.816 | 0.537 | 0.857 | 0.951 | 0.739 |
Download Data |
Period Mean (original grids) [mm d-1] |
Model Period Mean (intersection) [mm d-1] |
Benchmark Period Mean (intersection) [mm d-1] |
Model Period Mean (complement) [mm d-1] |
Benchmark Period Mean (complement) [mm d-1] |
Bias [mm d-1] |
RMSE [mm d-1] |
Phase Shift [months] |
Bias Score [1] |
RMSE Score [1] |
Seasonal Cycle Score [1] |
Spatial Distribution Score [1] |
Overall Score [1] |
|||
|---|---|---|---|---|---|---|---|---|---|---|---|---|---|---|---|---|
| Benchmark | [-] | 6.34 | ||||||||||||||
| CLM-CRUJRA | [-] | 5.53 | 5.60 | 6.15 | 7.52 | -0.593 | 3.36 | 0.806 | 0.633 | 0.495 | 0.908 | 0.948 | 0.696 | |||
| CLM-GSWP3 | [-] | 6.54 | 6.58 | 6.23 | 7.55 | 0.294 | 2.33 | 0.827 | 0.689 | 0.657 | 0.903 | 0.971 | 0.776 | |||
| CLM-Princeton | [-] | 5.59 | 5.55 | 6.26 | 7.54 | -0.759 | 3.29 | 0.761 | 0.635 | 0.536 | 0.905 | 0.937 | 0.710 | |||
| ISBA-CTRIP-CRUJRA | [-] | 5.39 | 5.53 | 6.43 | 6.05 | 5.03 | -0.812 | 3.41 | 0.834 | 0.626 | 0.524 | 0.895 | 0.879 | 0.690 | ||
| ISBA-CTRIP-GSWP3 | [-] | 6.75 | 6.45 | 6.43 | 10.5 | 5.03 | 0.0870 | 2.47 | 0.852 | 0.681 | 0.647 | 0.899 | 0.965 | 0.768 | ||
| ISBA-CTRIP-Princeton | [-] | 5.41 | 5.35 | 6.45 | 6.00 | 5.06 | -1.02 | 3.48 | 0.757 | 0.600 | 0.518 | 0.904 | 0.916 | 0.691 | ||
| JSBACH-CRUJRA | [-] | 5.08 | 5.25 | 6.12 | 7.01 | -0.817 | 3.53 | 0.801 | 0.581 | 0.516 | 0.911 | 0.767 | 0.658 | |||
| JSBACH-GSWP3 | [-] | 6.72 | 6.59 | 6.12 | 7.01 | 0.503 | 2.55 | 0.878 | 0.665 | 0.643 | 0.894 | 0.881 | 0.745 | |||
| JSBACH-Princeton | [-] | 5.04 | 5.25 | 6.12 | 7.01 | -0.814 | 3.58 | 0.769 | 0.580 | 0.507 | 0.915 | 0.770 | 0.656 | |||
| Mean-CRUJRA | [-] | 5.49 | 5.50 | 6.36 | 4.67 | -0.862 | 3.22 | 0.841 | 0.622 | 0.528 | 0.897 | 0.780 | 0.671 | |||
| Mean-GSWP3 | [-] | 6.47 | 6.37 | 6.44 | 4.74 | -0.0697 | 2.17 | 0.677 | 0.706 | 0.684 | 0.924 | 0.877 | 0.775 | |||
| Mean-Princeton | [-] | 5.46 | 5.46 | 6.46 | 4.77 | -0.999 | 3.29 | 0.760 | 0.623 | 0.540 | 0.904 | 0.791 | 0.680 |
Download Data |
Period Mean (original grids) [mm d-1] |
Model Period Mean (intersection) [mm d-1] |
Benchmark Period Mean (intersection) [mm d-1] |
Model Period Mean (complement) [mm d-1] |
Benchmark Period Mean (complement) [mm d-1] |
Bias [mm d-1] |
RMSE [mm d-1] |
Phase Shift [months] |
Bias Score [1] |
RMSE Score [1] |
Seasonal Cycle Score [1] |
Spatial Distribution Score [1] |
Overall Score [1] |
|||
|---|---|---|---|---|---|---|---|---|---|---|---|---|---|---|---|---|
| Benchmark | [-] | 2.78 | ||||||||||||||
| CLM-CRUJRA | [-] | 2.70 | 2.70 | 2.76 | 2.56 | 3.70 | -0.0571 | 1.16 | 0.721 | 0.820 | 0.553 | 0.894 | 0.972 | 0.759 | ||
| CLM-GSWP3 | [-] | 2.91 | 2.90 | 2.76 | 2.65 | 3.69 | 0.140 | 0.812 | 0.581 | 0.838 | 0.671 | 0.917 | 0.987 | 0.817 | ||
| CLM-Princeton | [-] | 2.67 | 2.68 | 2.76 | 2.48 | 3.69 | -0.0777 | 1.06 | 0.664 | 0.827 | 0.597 | 0.904 | 0.973 | 0.779 | ||
| ISBA-CTRIP-CRUJRA | [-] | 2.70 | 2.73 | 2.78 | 2.66 | 4.23 | -0.0501 | 1.05 | 0.665 | 0.818 | 0.602 | 0.903 | 0.967 | 0.778 | ||
| ISBA-CTRIP-GSWP3 | [-] | 2.88 | 2.91 | 2.78 | 2.70 | 4.23 | 0.123 | 0.910 | 0.638 | 0.813 | 0.655 | 0.906 | 0.983 | 0.802 | ||
| ISBA-CTRIP-Princeton | [-] | 2.65 | 2.68 | 2.78 | 2.61 | 4.24 | -0.0960 | 1.15 | 0.724 | 0.804 | 0.575 | 0.895 | 0.968 | 0.763 | ||
| JSBACH-CRUJRA | [-] | 2.65 | 2.63 | 2.69 | 2.69 | 3.45 | -0.0565 | 1.02 | 0.651 | 0.826 | 0.607 | 0.902 | 0.955 | 0.779 | ||
| JSBACH-GSWP3 | [-] | 2.83 | 2.82 | 2.69 | 2.89 | 3.45 | 0.132 | 0.855 | 0.587 | 0.823 | 0.664 | 0.913 | 0.979 | 0.809 | ||
| JSBACH-Princeton | [-] | 2.63 | 2.61 | 2.69 | 2.62 | 3.45 | -0.0806 | 1.13 | 0.665 | 0.826 | 0.565 | 0.902 | 0.953 | 0.762 | ||
| Mean-CRUJRA | [-] | 2.70 | 2.73 | 2.78 | 2.71 | 3.11 | -0.0501 | 1.02 | 0.613 | 0.823 | 0.604 | 0.910 | 0.958 | 0.780 | ||
| Mean-GSWP3 | [-] | 2.86 | 2.90 | 2.78 | 2.76 | 3.11 | 0.123 | 0.750 | 0.518 | 0.841 | 0.702 | 0.924 | 0.988 | 0.831 | ||
| Mean-Princeton | [-] | 2.64 | 2.68 | 2.78 | 2.64 | 3.10 | -0.0961 | 1.05 | 0.632 | 0.826 | 0.603 | 0.908 | 0.959 | 0.780 |
Download Data |
Period Mean (original grids) [mm d-1] |
Model Period Mean (intersection) [mm d-1] |
Benchmark Period Mean (intersection) [mm d-1] |
Model Period Mean (complement) [mm d-1] |
Benchmark Period Mean (complement) [mm d-1] |
Bias [mm d-1] |
RMSE [mm d-1] |
Phase Shift [months] |
Bias Score [1] |
RMSE Score [1] |
Seasonal Cycle Score [1] |
Spatial Distribution Score [1] |
Overall Score [1] |
|||
|---|---|---|---|---|---|---|---|---|---|---|---|---|---|---|---|---|
| Benchmark | [-] | 8.65 | ||||||||||||||
| CLM-CRUJRA | [-] | 8.25 | 8.34 | 8.57 | 8.85 | -0.239 | 3.92 | 1.07 | 0.761 | 0.441 | 0.853 | 0.955 | 0.691 | |||
| CLM-GSWP3 | [-] | 8.33 | 8.35 | 8.38 | 8.79 | -0.0435 | 2.14 | 0.718 | 0.819 | 0.648 | 0.902 | 0.989 | 0.801 | |||
| CLM-Princeton | [-] | 8.01 | 8.04 | 8.39 | 8.78 | -0.355 | 3.76 | 1.18 | 0.762 | 0.447 | 0.844 | 0.949 | 0.690 | |||
| ISBA-CTRIP-CRUJRA | [-] | 8.17 | 8.09 | 8.41 | 9.28 | -0.310 | 3.61 | 1.23 | 0.760 | 0.466 | 0.831 | 0.928 | 0.690 | |||
| ISBA-CTRIP-GSWP3 | [-] | 8.41 | 8.23 | 8.41 | 9.28 | -0.180 | 2.60 | 0.920 | 0.782 | 0.610 | 0.869 | 0.983 | 0.771 | |||
| ISBA-CTRIP-Princeton | [-] | 8.08 | 7.99 | 8.40 | 9.30 | -0.419 | 3.94 | 1.23 | 0.748 | 0.433 | 0.829 | 0.961 | 0.681 | |||
| JSBACH-CRUJRA | [-] | 7.88 | 7.94 | 8.27 | 8.91 | -0.329 | 3.76 | 1.07 | 0.764 | 0.447 | 0.861 | 0.891 | 0.682 | |||
| JSBACH-GSWP3 | [-] | 8.09 | 8.11 | 8.27 | 8.91 | -0.162 | 2.32 | 0.807 | 0.793 | 0.629 | 0.897 | 0.908 | 0.771 | |||
| JSBACH-Princeton | [-] | 7.83 | 7.89 | 8.27 | 8.91 | -0.373 | 3.68 | 1.10 | 0.760 | 0.450 | 0.862 | 0.895 | 0.683 | |||
| Mean-CRUJRA | [-] | 8.23 | 8.31 | 8.63 | 9.53 | -0.324 | 3.62 | 1.13 | 0.764 | 0.469 | 0.843 | 0.883 | 0.686 | |||
| Mean-GSWP3 | [-] | 8.05 | 8.18 | 8.41 | 9.50 | -0.229 | 2.13 | 0.707 | 0.818 | 0.660 | 0.904 | 0.933 | 0.795 | |||
| Mean-Princeton | [-] | 7.91 | 7.99 | 8.40 | 9.52 | -0.415 | 3.73 | 1.11 | 0.765 | 0.451 | 0.857 | 0.899 | 0.685 |
Download Data |
Period Mean (original grids) [mm d-1] |
Model Period Mean (intersection) [mm d-1] |
Benchmark Period Mean (intersection) [mm d-1] |
Model Period Mean (complement) [mm d-1] |
Benchmark Period Mean (complement) [mm d-1] |
Bias [mm d-1] |
RMSE [mm d-1] |
Phase Shift [months] |
Bias Score [1] |
RMSE Score [1] |
Seasonal Cycle Score [1] |
Spatial Distribution Score [1] |
Overall Score [1] |
|||
|---|---|---|---|---|---|---|---|---|---|---|---|---|---|---|---|---|
| Benchmark | [-] | 4.15 | ||||||||||||||
| CLM-CRUJRA | [-] | 4.13 | 4.11 | 4.07 | 3.83 | 5.31 | 0.0441 | 2.23 | 0.746 | 0.851 | 0.546 | 0.906 | 0.989 | 0.767 | ||
| CLM-GSWP3 | [-] | 4.10 | 4.09 | 4.05 | 3.33 | 5.20 | 0.0300 | 1.34 | 0.428 | 0.891 | 0.693 | 0.946 | 0.992 | 0.843 | ||
| CLM-Princeton | [-] | 4.05 | 4.03 | 4.06 | 3.74 | 5.20 | -0.0310 | 2.05 | 0.642 | 0.859 | 0.569 | 0.922 | 0.988 | 0.782 | ||
| ISBA-CTRIP-CRUJRA | [-] | 4.13 | 4.11 | 4.09 | 4.02 | 5.48 | 0.0230 | 2.04 | 0.657 | 0.857 | 0.574 | 0.918 | 0.986 | 0.782 | ||
| ISBA-CTRIP-GSWP3 | [-] | 4.13 | 4.09 | 4.09 | 3.21 | 5.48 | -0.00578 | 1.54 | 0.519 | 0.870 | 0.670 | 0.931 | 0.987 | 0.825 | ||
| ISBA-CTRIP-Princeton | [-] | 4.10 | 4.04 | 4.09 | 3.99 | 5.49 | -0.0451 | 2.19 | 0.685 | 0.846 | 0.553 | 0.914 | 0.984 | 0.770 | ||
| JSBACH-CRUJRA | [-] | 3.99 | 3.98 | 3.98 | 3.74 | 4.85 | -0.0113 | 2.01 | 0.626 | 0.856 | 0.572 | 0.930 | 0.982 | 0.782 | ||
| JSBACH-GSWP3 | [-] | 3.99 | 3.99 | 3.98 | 3.31 | 4.85 | -9.87e-05 | 1.39 | 0.458 | 0.877 | 0.684 | 0.946 | 0.979 | 0.834 | ||
| JSBACH-Princeton | [-] | 3.95 | 3.93 | 3.98 | 3.64 | 4.85 | -0.0569 | 2.02 | 0.635 | 0.855 | 0.569 | 0.928 | 0.981 | 0.780 | ||
| Mean-CRUJRA | [-] | 4.18 | 4.16 | 4.13 | 3.94 | 5.31 | 0.0267 | 2.08 | 0.720 | 0.856 | 0.573 | 0.907 | 0.986 | 0.779 | ||
| Mean-GSWP3 | [-] | 4.11 | 4.10 | 4.09 | 3.38 | 5.31 | 0.00454 | 1.28 | 0.382 | 0.895 | 0.711 | 0.952 | 0.989 | 0.852 | ||
| Mean-Princeton | [-] | 4.07 | 4.05 | 4.09 | 3.89 | 5.31 | -0.0439 | 2.05 | 0.626 | 0.860 | 0.573 | 0.922 | 0.984 | 0.782 |
Download Data |
Period Mean (original grids) [mm d-1] |
Model Period Mean (intersection) [mm d-1] |
Benchmark Period Mean (intersection) [mm d-1] |
Model Period Mean (complement) [mm d-1] |
Benchmark Period Mean (complement) [mm d-1] |
Bias [mm d-1] |
RMSE [mm d-1] |
Phase Shift [months] |
Bias Score [1] |
RMSE Score [1] |
Seasonal Cycle Score [1] |
Spatial Distribution Score [1] |
Overall Score [1] |
|||
|---|---|---|---|---|---|---|---|---|---|---|---|---|---|---|---|---|
| Benchmark | [-] | 0.883 | ||||||||||||||
| CLM-CRUJRA | [-] | 0.978 | 0.992 | 0.887 | 0.552 | 0.638 | 0.104 | 0.519 | 0.707 | 0.788 | 0.523 | 0.913 | 0.945 | 0.738 | ||
| CLM-GSWP3 | [-] | 0.412 | 1.09 | 0.862 | 0.945 | 0.626 | 0.226 | 0.490 | 0.511 | 0.718 | 0.578 | 0.926 | 0.870 | 0.734 | ||
| CLM-Princeton | [-] | 0.865 | 0.955 | 0.858 | 0.515 | 0.626 | 0.0957 | 0.468 | 0.657 | 0.771 | 0.563 | 0.912 | 0.894 | 0.741 | ||
| ISBA-CTRIP-CRUJRA | [-] | 0.970 | 0.974 | 0.858 | 0.585 | 0.657 | 0.116 | 0.466 | 0.591 | 0.780 | 0.556 | 0.923 | 0.944 | 0.752 | ||
| ISBA-CTRIP-GSWP3 | [-] | 1.07 | 1.08 | 0.858 | 0.789 | 0.657 | 0.220 | 0.492 | 0.555 | 0.715 | 0.584 | 0.918 | 0.886 | 0.737 | ||
| ISBA-CTRIP-Princeton | [-] | 0.934 | 0.940 | 0.855 | 0.521 | 0.654 | 0.0857 | 0.471 | 0.662 | 0.771 | 0.557 | 0.911 | 0.905 | 0.740 | ||
| JSBACH-CRUJRA | [-] | 0.928 | 0.995 | 0.880 | 0.642 | 0.634 | 0.116 | 0.469 | 0.621 | 0.787 | 0.564 | 0.923 | 0.940 | 0.755 | ||
| JSBACH-GSWP3 | [-] | 0.688 | 1.11 | 0.880 | 0.948 | 0.634 | 0.231 | 0.484 | 0.513 | 0.716 | 0.599 | 0.922 | 0.887 | 0.745 | ||
| JSBACH-Princeton | [-] | 0.917 | 0.978 | 0.880 | 0.578 | 0.634 | 0.0994 | 0.504 | 0.657 | 0.775 | 0.542 | 0.917 | 0.903 | 0.736 | ||
| Mean-CRUJRA | [-] | 0.973 | 0.988 | 0.884 | 0.566 | 0.594 | 0.105 | 0.470 | 0.690 | 0.789 | 0.564 | 0.915 | 0.952 | 0.757 | ||
| Mean-GSWP3 | [-] | 1.07 | 1.08 | 0.858 | 0.861 | 0.565 | 0.225 | 0.457 | 0.503 | 0.717 | 0.613 | 0.923 | 0.899 | 0.753 | ||
| Mean-Princeton | [-] | 0.929 | 0.945 | 0.855 | 0.530 | 0.565 | 0.0897 | 0.459 | 0.659 | 0.775 | 0.567 | 0.911 | 0.904 | 0.745 |
Download Data |
Period Mean (original grids) [mm d-1] |
Model Period Mean (intersection) [mm d-1] |
Benchmark Period Mean (intersection) [mm d-1] |
Model Period Mean (complement) [mm d-1] |
Benchmark Period Mean (complement) [mm d-1] |
Bias [mm d-1] |
RMSE [mm d-1] |
Phase Shift [months] |
Bias Score [1] |
RMSE Score [1] |
Seasonal Cycle Score [1] |
Spatial Distribution Score [1] |
Overall Score [1] |
|||
|---|---|---|---|---|---|---|---|---|---|---|---|---|---|---|---|---|
| Benchmark | [-] | 1.51 | ||||||||||||||
| CLM-CRUJRA | [-] | 1.52 | 1.50 | 1.51 | 1.83 | 1.88 | -0.00480 | 0.795 | 0.715 | 0.851 | 0.569 | 0.908 | 0.981 | 0.776 | ||
| CLM-GSWP3 | [-] | 1.62 | 1.61 | 1.51 | 1.69 | 1.84 | 0.0960 | 0.578 | 0.608 | 0.855 | 0.669 | 0.922 | 0.987 | 0.821 | ||
| CLM-Princeton | [-] | 1.50 | 1.48 | 1.51 | 1.74 | 1.84 | -0.0291 | 0.742 | 0.626 | 0.855 | 0.598 | 0.923 | 0.983 | 0.792 | ||
| ISBA-CTRIP-CRUJRA | [-] | 1.54 | 1.52 | 1.51 | 2.08 | 2.61 | 0.00572 | 0.708 | 0.609 | 0.849 | 0.615 | 0.921 | 0.979 | 0.796 | ||
| ISBA-CTRIP-GSWP3 | [-] | 1.62 | 1.62 | 1.51 | 2.02 | 2.61 | 0.0997 | 0.633 | 0.654 | 0.834 | 0.654 | 0.913 | 0.985 | 0.808 | ||
| ISBA-CTRIP-Princeton | [-] | 1.51 | 1.50 | 1.51 | 2.03 | 2.61 | -0.0161 | 0.788 | 0.670 | 0.844 | 0.582 | 0.914 | 0.982 | 0.781 | ||
| JSBACH-CRUJRA | [-] | 1.51 | 1.49 | 1.49 | 2.37 | 1.88 | 0.00846 | 0.712 | 0.626 | 0.843 | 0.613 | 0.919 | 0.974 | 0.793 | ||
| JSBACH-GSWP3 | [-] | 1.59 | 1.59 | 1.49 | 2.31 | 1.88 | 0.107 | 0.612 | 0.667 | 0.831 | 0.662 | 0.915 | 0.985 | 0.811 | ||
| JSBACH-Princeton | [-] | 1.48 | 1.47 | 1.49 | 2.29 | 1.88 | -0.0200 | 0.800 | 0.647 | 0.842 | 0.570 | 0.918 | 0.976 | 0.775 | ||
| Mean-CRUJRA | [-] | 1.52 | 1.52 | 1.51 | 2.08 | 2.10 | 0.0104 | 0.693 | 0.593 | 0.858 | 0.620 | 0.924 | 0.978 | 0.800 | ||
| Mean-GSWP3 | [-] | 1.63 | 1.62 | 1.51 | 2.06 | 2.06 | 0.105 | 0.530 | 0.527 | 0.856 | 0.701 | 0.934 | 0.992 | 0.837 | ||
| Mean-Princeton | [-] | 1.50 | 1.50 | 1.51 | 2.03 | 2.05 | -0.0160 | 0.723 | 0.577 | 0.860 | 0.608 | 0.929 | 0.980 | 0.797 |
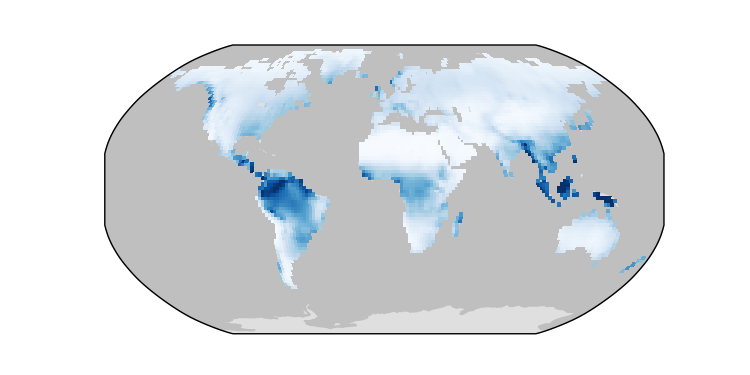
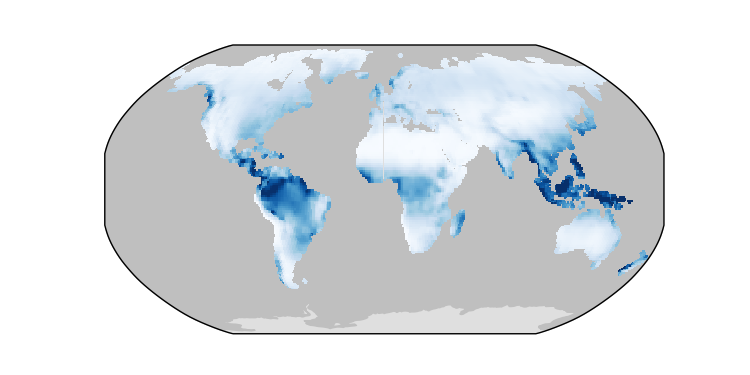
Temporally integrated period mean click to collapse contents


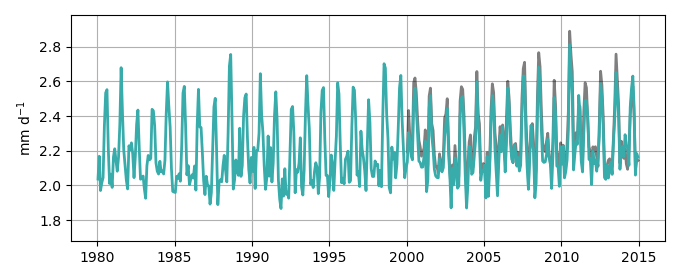
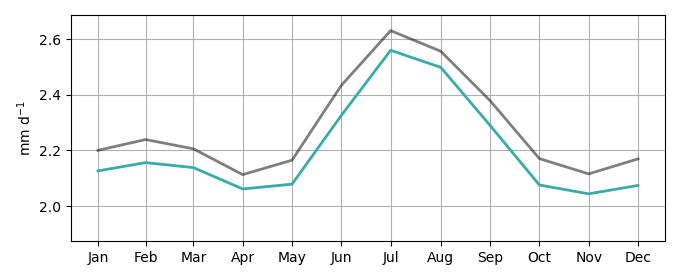
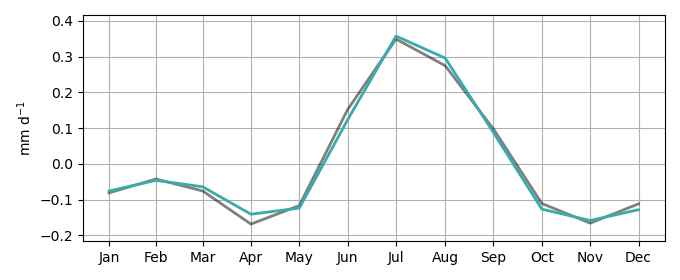
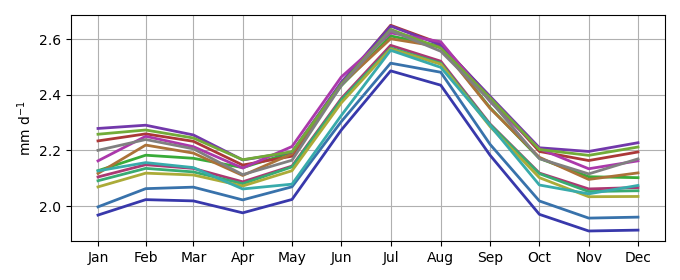
Spatially integrated regional mean click to collapse contents