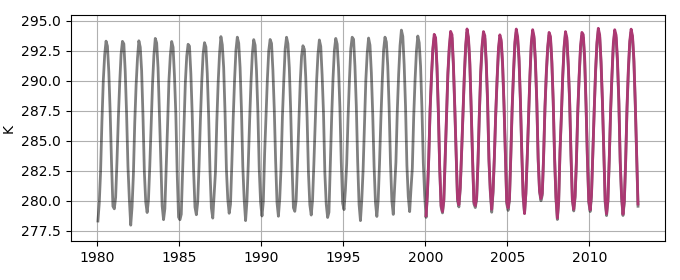
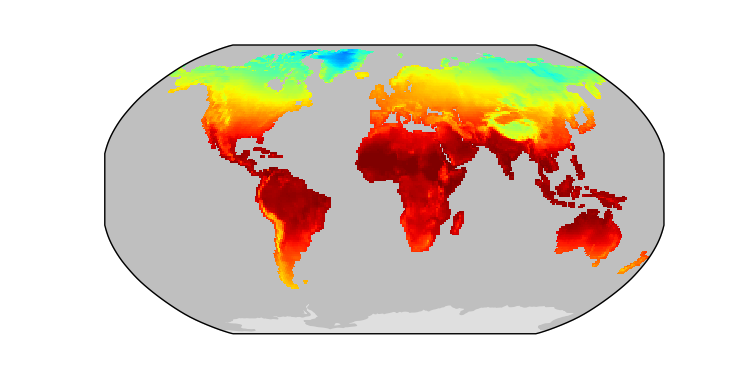
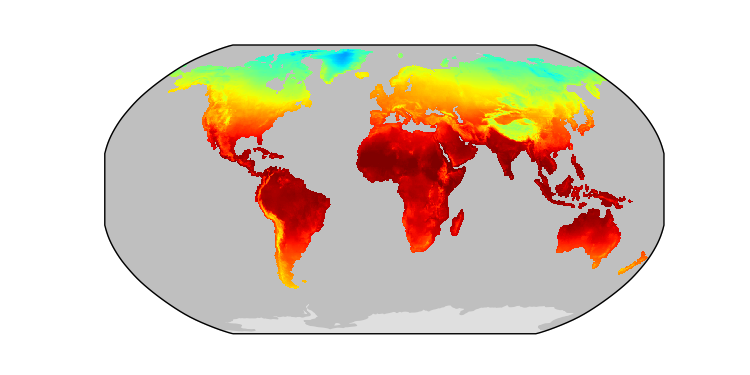
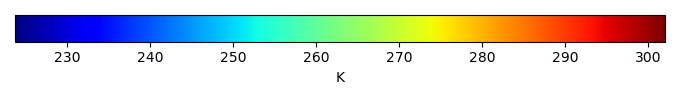
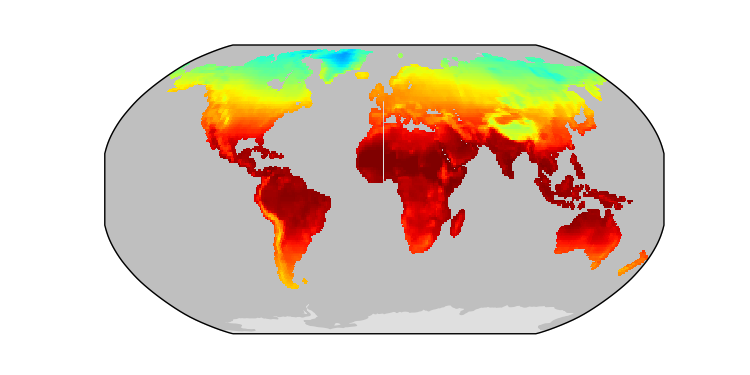
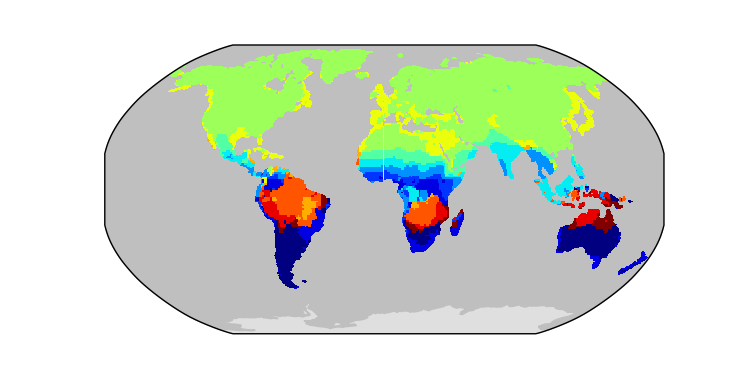
SurfaceAirTemperature / CRU4.02 / 1980-2018 / global / Mean-Princeton
Global - Land
CLM-CRUJRA
Download Data |
Period Mean (original grids) [K] |
Model Period Mean (intersection) [K] |
Benchmark Period Mean (intersection) [K] |
Model Period Mean (complement) [K] |
Benchmark Period Mean (complement) [K] |
Bias [K] |
RMSE [K] |
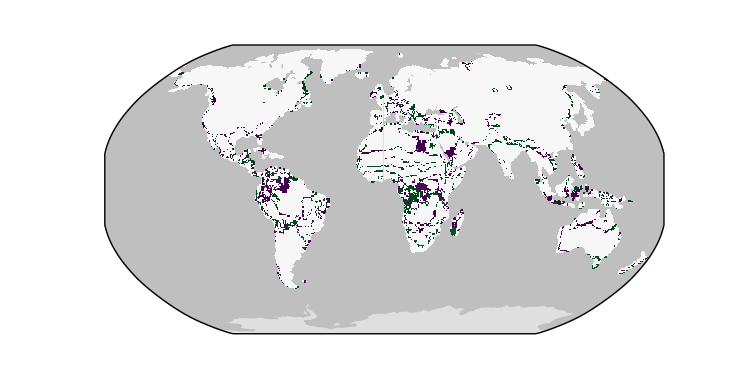
Phase Shift [months] |
Bias Score [1] |
RMSE Score [1] |
Seasonal Cycle Score [1] |
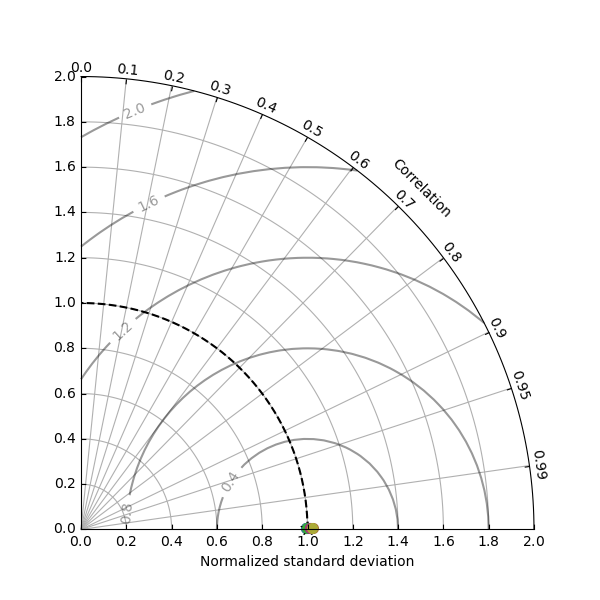
Spatial Distribution Score [1] |
Overall Score [1] |
|||
|---|---|---|---|---|---|---|---|---|---|---|---|---|---|---|---|---|
| Benchmark | [-] | 272. | ||||||||||||||
| CLM-CRUJRA | [-] | 271. | 271. | 272. | 273. | -0.549 | 1.43 | 0.0231 | 0.915 | 0.914 | 0.998 | 0.969 | 0.942 | |||
| CLM-GSWP3 | [-] | 272. | 272. | 272. | 273. | 0.159 | 1.29 | 0.0246 | 0.929 | 0.918 | 0.998 | 0.975 | 0.948 | |||
| CLM-Princeton | [-] | 272. | 272. | 272. | 273. | 0.261 | 1.07 | 0.0321 | 0.930 | 0.937 | 0.998 | 0.979 | 0.956 | |||
| ISBA-CTRIP-CRUJRA | [-] | 272. | 272. | 272. | 273. | 0.164 | 0.870 | 0.0211 | 0.927 | 0.969 | 0.999 | 0.978 | 0.968 | |||
| ISBA-CTRIP-GSWP3 | [-] | 272. | 272. | 272. | 0.151 | 1.27 | 0.0391 | 0.918 | 0.931 | 0.997 | 0.965 | 0.948 | ||||
| ISBA-CTRIP-Princeton | [-] | 272. | 272. | 272. | 273. | 0.0899 | 1.20 | 0.0346 | 0.922 | 0.935 | 0.998 | 0.967 | 0.952 | |||
| JSBACH-CRUJRA | [-] | 272. | 272. | 272. | 272. | 0.437 | 1.54 | 0.0261 | 0.910 | 0.918 | 0.998 | 0.985 | 0.946 | |||
| JSBACH-GSWP3 | [-] | 272. | 272. | 272. | 272. | 0.267 | 1.24 | 0.0297 | 0.919 | 0.937 | 0.998 | 0.984 | 0.955 | |||
| JSBACH-Princeton | [-] | 272. | 272. | 272. | 272. | 0.245 | 1.59 | 0.0295 | 0.912 | 0.909 | 0.998 | 0.985 | 0.943 | |||
| Mean-CRUJRA | [-] | 271. | 272. | 272. | 274. | -0.0218 | 0.927 | 0.0258 | 0.937 | 0.953 | 0.998 | 0.993 | 0.967 | |||
| Mean-GSWP3 | [-] | 272. | 272. | 272. | 0.168 | 1.07 | 0.0303 | 0.936 | 0.939 | 0.998 | 0.991 | 0.960 | ||||
| Mean-Princeton | [-] | 272. | 272. | 272. | 274. | 0.168 | 1.06 | 0.0389 | 0.936 | 0.940 | 0.997 | 0.993 | 0.961 |
Download Data |
Period Mean (original grids) [K] |
Model Period Mean (intersection) [K] |
Benchmark Period Mean (intersection) [K] |
Model Period Mean (complement) [K] |
Benchmark Period Mean (complement) [K] |
Bias [K] |
RMSE [K] |
Phase Shift [months] |
Bias Score [1] |
RMSE Score [1] |
Seasonal Cycle Score [1] |
Spatial Distribution Score [1] |
Overall Score [1] |
|||
|---|---|---|---|---|---|---|---|---|---|---|---|---|---|---|---|---|
| Benchmark | [-] | 287. | ||||||||||||||
| CLM-CRUJRA | [-] | 288. | 286. | 287. | 289. | 291. | -0.287 | 1.15 | 0.165 | 0.814 | 0.843 | 0.982 | 0.999 | 0.896 | ||
| CLM-GSWP3 | [-] | 289. | 287. | 287. | 290. | 291. | 0.222 | 1.13 | 0.147 | 0.825 | 0.839 | 0.985 | 1.00 | 0.898 | ||
| CLM-Princeton | [-] | 289. | 287. | 287. | 289. | 291. | 0.320 | 1.05 | 0.174 | 0.817 | 0.857 | 0.982 | 1.00 | 0.902 | ||
| ISBA-CTRIP-CRUJRA | [-] | 287. | 287. | 287. | 289. | 295. | 0.0281 | 0.802 | 0.119 | 0.843 | 0.938 | 0.987 | 1.00 | 0.941 | ||
| ISBA-CTRIP-GSWP3 | [-] | 287. | 287. | 287. | 291. | 0.0762 | 1.16 | 0.180 | 0.826 | 0.851 | 0.980 | 1.00 | 0.901 | |||
| ISBA-CTRIP-Princeton | [-] | 287. | 287. | 287. | 289. | 295. | 0.0385 | 1.10 | 0.165 | 0.830 | 0.857 | 0.982 | 1.00 | 0.905 | ||
| JSBACH-CRUJRA | [-] | 288. | 287. | 286. | 287. | 290. | 0.300 | 1.43 | 0.274 | 0.792 | 0.824 | 0.969 | 1.00 | 0.882 | ||
| JSBACH-GSWP3 | [-] | 288. | 287. | 286. | 287. | 290. | 0.0610 | 1.13 | 0.155 | 0.829 | 0.865 | 0.983 | 1.00 | 0.908 | ||
| JSBACH-Princeton | [-] | 288. | 287. | 286. | 287. | 290. | 0.295 | 1.39 | 0.185 | 0.787 | 0.834 | 0.980 | 1.00 | 0.887 | ||
| Mean-CRUJRA | [-] | 287. | 287. | 287. | 289. | 296. | 0.00767 | 0.851 | 0.143 | 0.850 | 0.900 | 0.984 | 1.00 | 0.927 | ||
| Mean-GSWP3 | [-] | 287. | 287. | 287. | 290. | 296. | 0.133 | 0.979 | 0.142 | 0.849 | 0.864 | 0.984 | 1.00 | 0.912 | ||
| Mean-Princeton | [-] | 287. | 287. | 287. | 290. | 296. | 0.221 | 0.996 | 0.164 | 0.830 | 0.864 | 0.983 | 1.00 | 0.908 |
Download Data |
Period Mean (original grids) [K] |
Model Period Mean (intersection) [K] |
Benchmark Period Mean (intersection) [K] |
Model Period Mean (complement) [K] |
Benchmark Period Mean (complement) [K] |
Bias [K] |
RMSE [K] |
Phase Shift [months] |
Bias Score [1] |
RMSE Score [1] |
Seasonal Cycle Score [1] |
Spatial Distribution Score [1] |
Overall Score [1] |
|||
|---|---|---|---|---|---|---|---|---|---|---|---|---|---|---|---|---|
| Benchmark | [-] | 297. | ||||||||||||||
| CLM-CRUJRA | [-] | 297. | 297. | 297. | 297. | -0.0941 | 0.885 | 0.150 | 0.877 | 0.875 | 0.988 | 1.00 | 0.923 | |||
| CLM-GSWP3 | [-] | 298. | 297. | 297. | 297. | 0.279 | 0.931 | 0.148 | 0.868 | 0.871 | 0.988 | 1.00 | 0.920 | |||
| CLM-Princeton | [-] | 298. | 298. | 297. | 297. | 0.410 | 0.937 | 0.176 | 0.857 | 0.882 | 0.986 | 1.00 | 0.921 | |||
| ISBA-CTRIP-CRUJRA | [-] | 297. | 297. | 297. | 299. | -0.0774 | 0.629 | 0.119 | 0.886 | 0.944 | 0.990 | 0.999 | 0.953 | |||
| ISBA-CTRIP-GSWP3 | [-] | 297. | 297. | 297. | -0.0414 | 0.941 | 0.163 | 0.870 | 0.876 | 0.986 | 0.998 | 0.921 | ||||
| ISBA-CTRIP-Princeton | [-] | 297. | 297. | 297. | 299. | -0.0186 | 0.920 | 0.160 | 0.873 | 0.881 | 0.987 | 0.998 | 0.924 | |||
| JSBACH-CRUJRA | [-] | 297. | 297. | 297. | 297. | 0.0946 | 1.30 | 0.331 | 0.842 | 0.826 | 0.971 | 0.996 | 0.892 | |||
| JSBACH-GSWP3 | [-] | 297. | 297. | 297. | 297. | -0.104 | 0.931 | 0.151 | 0.875 | 0.885 | 0.988 | 0.998 | 0.926 | |||
| JSBACH-Princeton | [-] | 298. | 298. | 297. | 297. | 0.263 | 1.15 | 0.161 | 0.843 | 0.862 | 0.987 | 0.998 | 0.910 | |||
| Mean-CRUJRA | [-] | 297. | 297. | 297. | 299. | -0.00793 | 0.703 | 0.141 | 0.895 | 0.911 | 0.987 | 1.00 | 0.941 | |||
| Mean-GSWP3 | [-] | 297. | 297. | 297. | 299. | 0.0770 | 0.791 | 0.128 | 0.896 | 0.888 | 0.989 | 1.00 | 0.932 | |||
| Mean-Princeton | [-] | 298. | 298. | 297. | 299. | 0.265 | 0.854 | 0.148 | 0.879 | 0.888 | 0.988 | 1.00 | 0.929 |
Download Data |
Period Mean (original grids) [K] |
Model Period Mean (intersection) [K] |
Benchmark Period Mean (intersection) [K] |
Model Period Mean (complement) [K] |
Benchmark Period Mean (complement) [K] |
Bias [K] |
RMSE [K] |
Phase Shift [months] |
Bias Score [1] |
RMSE Score [1] |
Seasonal Cycle Score [1] |
Spatial Distribution Score [1] |
Overall Score [1] |
|||
|---|---|---|---|---|---|---|---|---|---|---|---|---|---|---|---|---|
| Benchmark | [-] | 283. | ||||||||||||||
| CLM-CRUJRA | [-] | 283. | 283. | 283. | 288. | -0.0331 | 1.47 | 0.0380 | 0.864 | 0.908 | 0.997 | 0.994 | 0.934 | |||
| CLM-GSWP3 | [-] | 283. | 283. | 283. | 288. | 0.309 | 1.52 | 0.0346 | 0.860 | 0.906 | 0.997 | 0.997 | 0.933 | |||
| CLM-Princeton | [-] | 284. | 284. | 283. | 288. | 0.437 | 1.50 | 0.0430 | 0.856 | 0.918 | 0.997 | 0.995 | 0.937 | |||
| ISBA-CTRIP-CRUJRA | [-] | 283. | 283. | 283. | 289. | 0.0265 | 1.37 | 0.0373 | 0.853 | 0.957 | 0.997 | 0.998 | 0.953 | |||
| ISBA-CTRIP-GSWP3 | [-] | 283. | 283. | 283. | 0.0960 | 1.66 | 0.0415 | 0.845 | 0.918 | 0.997 | 0.995 | 0.935 | ||||
| ISBA-CTRIP-Princeton | [-] | 283. | 283. | 283. | 289. | 0.101 | 1.65 | 0.0448 | 0.846 | 0.920 | 0.997 | 0.995 | 0.935 | |||
| JSBACH-CRUJRA | [-] | 283. | 283. | 283. | 287. | -0.0676 | 1.98 | 0.0519 | 0.830 | 0.900 | 0.996 | 0.996 | 0.925 | |||
| JSBACH-GSWP3 | [-] | 283. | 283. | 283. | 287. | -0.0179 | 1.76 | 0.0403 | 0.838 | 0.921 | 0.997 | 0.998 | 0.935 | |||
| JSBACH-Princeton | [-] | 283. | 283. | 283. | 287. | 0.00864 | 2.00 | 0.0630 | 0.829 | 0.897 | 0.995 | 0.998 | 0.923 | |||
| Mean-CRUJRA | [-] | 283. | 283. | 283. | 289. | 0.00385 | 1.29 | 0.0268 | 0.874 | 0.942 | 0.998 | 1.00 | 0.951 | |||
| Mean-GSWP3 | [-] | 283. | 283. | 283. | 289. | 0.175 | 1.40 | 0.0335 | 0.872 | 0.925 | 0.998 | 1.00 | 0.944 | |||
| Mean-Princeton | [-] | 283. | 283. | 283. | 289. | 0.237 | 1.43 | 0.0414 | 0.871 | 0.926 | 0.997 | 1.00 | 0.944 |
Download Data |
Period Mean (original grids) [K] |
Model Period Mean (intersection) [K] |
Benchmark Period Mean (intersection) [K] |
Model Period Mean (complement) [K] |
Benchmark Period Mean (complement) [K] |
Bias [K] |
RMSE [K] |
Phase Shift [months] |
Bias Score [1] |
RMSE Score [1] |
Seasonal Cycle Score [1] |
Spatial Distribution Score [1] |
Overall Score [1] |
|||
|---|---|---|---|---|---|---|---|---|---|---|---|---|---|---|---|---|
| Benchmark | [-] | 282. | ||||||||||||||
| CLM-CRUJRA | [-] | 282. | 283. | 283. | 282. | 0.550 | 2.10 | 0.433 | 0.594 | 0.764 | 0.954 | 0.936 | 0.802 | |||
| CLM-GSWP3 | [-] | 282. | 284. | 283. | 282. | 1.06 | 2.29 | 0.576 | 0.584 | 0.755 | 0.919 | 0.923 | 0.787 | |||
| CLM-Princeton | [-] | 283. | 284. | 283. | 282. | 1.26 | 2.26 | 0.693 | 0.578 | 0.791 | 0.901 | 0.928 | 0.798 | |||
| ISBA-CTRIP-CRUJRA | [-] | 282. | 283. | 282. | 282. | 1.08 | 1.98 | 0.389 | 0.631 | 0.877 | 0.946 | 0.943 | 0.855 | |||
| ISBA-CTRIP-GSWP3 | [-] | 282. | 283. | 282. | 0.976 | 2.22 | 0.541 | 0.632 | 0.785 | 0.923 | 0.929 | 0.811 | ||||
| ISBA-CTRIP-Princeton | [-] | 282. | 283. | 282. | 281. | 0.874 | 2.17 | 0.445 | 0.636 | 0.793 | 0.942 | 0.932 | 0.819 | |||
| JSBACH-CRUJRA | [-] | 284. | 284. | 282. | 283. | 1.97 | 3.03 | 0.669 | 0.500 | 0.767 | 0.912 | 0.862 | 0.761 | |||
| JSBACH-GSWP3 | [-] | 284. | 284. | 282. | 283. | 1.91 | 2.96 | 0.476 | 0.501 | 0.769 | 0.949 | 0.878 | 0.773 | |||
| JSBACH-Princeton | [-] | 284. | 285. | 282. | 283. | 2.28 | 3.22 | 0.858 | 0.493 | 0.739 | 0.873 | 0.872 | 0.743 | |||
| Mean-CRUJRA | [-] | 283. | 283. | 283. | 281. | 0.777 | 1.83 | 0.273 | 0.642 | 0.857 | 0.971 | 0.970 | 0.859 | |||
| Mean-GSWP3 | [-] | 284. | 284. | 282. | 1.10 | 2.05 | 0.454 | 0.629 | 0.802 | 0.937 | 0.957 | 0.825 | ||||
| Mean-Princeton | [-] | 284. | 284. | 283. | 281. | 1.13 | 2.02 | 0.611 | 0.628 | 0.812 | 0.908 | 0.962 | 0.824 |
Download Data |
Period Mean (original grids) [K] |
Model Period Mean (intersection) [K] |
Benchmark Period Mean (intersection) [K] |
Model Period Mean (complement) [K] |
Benchmark Period Mean (complement) [K] |
Bias [K] |
RMSE [K] |
Phase Shift [months] |
Bias Score [1] |
RMSE Score [1] |
Seasonal Cycle Score [1] |
Spatial Distribution Score [1] |
Overall Score [1] |
|||
|---|---|---|---|---|---|---|---|---|---|---|---|---|---|---|---|---|
| Benchmark | [-] | 282. | ||||||||||||||
| CLM-CRUJRA | [-] | 282. | 282. | 282. | 282. | -0.234 | 1.18 | 0.0809 | 0.875 | 0.901 | 0.992 | 0.997 | 0.933 | |||
| CLM-GSWP3 | [-] | 282. | 282. | 282. | 282. | 0.230 | 1.16 | 0.0729 | 0.881 | 0.898 | 0.993 | 0.997 | 0.933 | |||
| CLM-Princeton | [-] | 282. | 283. | 282. | 282. | 0.337 | 1.00 | 0.0941 | 0.878 | 0.924 | 0.991 | 0.997 | 0.943 | |||
| ISBA-CTRIP-CRUJRA | [-] | 282. | 282. | 282. | 281. | 0.158 | 0.895 | 0.0671 | 0.880 | 0.958 | 0.994 | 0.997 | 0.957 | |||
| ISBA-CTRIP-GSWP3 | [-] | 282. | 282. | 282. | 0.214 | 1.17 | 0.0935 | 0.867 | 0.916 | 0.992 | 0.994 | 0.937 | ||||
| ISBA-CTRIP-Princeton | [-] | 282. | 282. | 282. | 281. | 0.169 | 1.13 | 0.0915 | 0.872 | 0.922 | 0.992 | 0.995 | 0.940 | |||
| JSBACH-CRUJRA | [-] | 282. | 282. | 282. | 283. | 0.380 | 1.32 | 0.118 | 0.858 | 0.915 | 0.987 | 0.995 | 0.934 | |||
| JSBACH-GSWP3 | [-] | 282. | 282. | 282. | 283. | 0.202 | 1.14 | 0.0724 | 0.868 | 0.928 | 0.993 | 0.997 | 0.943 | |||
| JSBACH-Princeton | [-] | 282. | 282. | 282. | 283. | 0.306 | 1.46 | 0.107 | 0.857 | 0.894 | 0.989 | 0.992 | 0.925 | |||
| Mean-CRUJRA | [-] | 282. | 282. | 282. | 282. | 0.0655 | 0.865 | 0.0587 | 0.893 | 0.947 | 0.995 | 0.999 | 0.956 | |||
| Mean-GSWP3 | [-] | 282. | 282. | 282. | 284. | 0.216 | 0.990 | 0.0666 | 0.885 | 0.926 | 0.994 | 0.998 | 0.946 | |||
| Mean-Princeton | [-] | 282. | 282. | 282. | 282. | 0.246 | 0.994 | 0.0892 | 0.886 | 0.928 | 0.992 | 0.998 | 0.946 |
Download Data |
Period Mean (original grids) [K] |
Model Period Mean (intersection) [K] |
Benchmark Period Mean (intersection) [K] |
Model Period Mean (complement) [K] |
Benchmark Period Mean (complement) [K] |
Bias [K] |
RMSE [K] |
Phase Shift [months] |
Bias Score [1] |
RMSE Score [1] |
Seasonal Cycle Score [1] |
Spatial Distribution Score [1] |
Overall Score [1] |
|||
|---|---|---|---|---|---|---|---|---|---|---|---|---|---|---|---|---|
| Benchmark | [-] | 299. | ||||||||||||||
| CLM-CRUJRA | [-] | 298. | 298. | 299. | 299. | -0.453 | 0.973 | 0.628 | 0.416 | 0.606 | 0.910 | 0.983 | 0.704 | |||
| CLM-GSWP3 | [-] | 299. | 299. | 299. | 299. | 0.141 | 0.882 | 0.669 | 0.512 | 0.554 | 0.906 | 0.999 | 0.705 | |||
| CLM-Princeton | [-] | 299. | 299. | 299. | 300. | 0.273 | 0.857 | 0.690 | 0.453 | 0.614 | 0.900 | 0.998 | 0.716 | |||
| ISBA-CTRIP-CRUJRA | [-] | 299. | 299. | 299. | 300. | 0.0313 | 0.731 | 0.528 | 0.555 | 0.855 | 0.922 | 0.999 | 0.837 | |||
| ISBA-CTRIP-GSWP3 | [-] | 299. | 299. | 299. | -0.120 | 1.07 | 0.880 | 0.507 | 0.568 | 0.870 | 0.941 | 0.691 | ||||
| ISBA-CTRIP-Princeton | [-] | 299. | 299. | 299. | 300. | -0.0980 | 1.05 | 0.771 | 0.515 | 0.586 | 0.889 | 0.941 | 0.703 | |||
| JSBACH-CRUJRA | [-] | 299. | 299. | 299. | 299. | -0.108 | 1.02 | 1.16 | 0.461 | 0.593 | 0.821 | 1.00 | 0.694 | |||
| JSBACH-GSWP3 | [-] | 299. | 299. | 299. | 299. | -0.127 | 0.944 | 0.750 | 0.518 | 0.611 | 0.891 | 0.997 | 0.726 | |||
| JSBACH-Princeton | [-] | 299. | 299. | 299. | 299. | 0.442 | 1.13 | 1.03 | 0.376 | 0.555 | 0.851 | 1.00 | 0.668 | |||
| Mean-CRUJRA | [-] | 299. | 299. | 299. | 300. | -0.148 | 0.785 | 0.665 | 0.512 | 0.752 | 0.901 | 0.997 | 0.783 | |||
| Mean-GSWP3 | [-] | 299. | 299. | 299. | 0.0267 | 0.908 | 0.713 | 0.517 | 0.590 | 0.895 | 1.00 | 0.718 | ||||
| Mean-Princeton | [-] | 299. | 299. | 299. | 300. | 0.200 | 0.907 | 0.620 | 0.456 | 0.621 | 0.912 | 1.00 | 0.722 |
Download Data |
Period Mean (original grids) [K] |
Model Period Mean (intersection) [K] |
Benchmark Period Mean (intersection) [K] |
Model Period Mean (complement) [K] |
Benchmark Period Mean (complement) [K] |
Bias [K] |
RMSE [K] |
Phase Shift [months] |
Bias Score [1] |
RMSE Score [1] |
Seasonal Cycle Score [1] |
Spatial Distribution Score [1] |
Overall Score [1] |
|||
|---|---|---|---|---|---|---|---|---|---|---|---|---|---|---|---|---|
| Benchmark | [-] | 298. | ||||||||||||||
| CLM-CRUJRA | [-] | 298. | 298. | 298. | 299. | -0.255 | 0.898 | 0.339 | 0.661 | 0.716 | 0.961 | 0.993 | 0.809 | |||
| CLM-GSWP3 | [-] | 298. | 298. | 298. | 299. | 0.262 | 0.870 | 0.269 | 0.691 | 0.711 | 0.970 | 0.997 | 0.816 | |||
| CLM-Princeton | [-] | 298. | 298. | 298. | 299. | 0.327 | 0.854 | 0.333 | 0.673 | 0.729 | 0.962 | 0.997 | 0.818 | |||
| ISBA-CTRIP-CRUJRA | [-] | 298. | 298. | 298. | 299. | -0.0928 | 0.619 | 0.212 | 0.737 | 0.894 | 0.975 | 0.994 | 0.899 | |||
| ISBA-CTRIP-GSWP3 | [-] | 298. | 298. | 298. | -0.0436 | 0.893 | 0.362 | 0.704 | 0.719 | 0.956 | 0.991 | 0.818 | ||||
| ISBA-CTRIP-Princeton | [-] | 298. | 298. | 298. | 299. | -0.0567 | 0.875 | 0.308 | 0.710 | 0.729 | 0.965 | 0.990 | 0.824 | |||
| JSBACH-CRUJRA | [-] | 298. | 298. | 298. | 299. | 0.337 | 1.21 | 0.539 | 0.614 | 0.666 | 0.934 | 0.998 | 0.775 | |||
| JSBACH-GSWP3 | [-] | 298. | 298. | 298. | 299. | -0.123 | 0.874 | 0.301 | 0.709 | 0.743 | 0.965 | 0.994 | 0.831 | |||
| JSBACH-Princeton | [-] | 298. | 298. | 298. | 299. | 0.402 | 1.11 | 0.345 | 0.597 | 0.702 | 0.961 | 0.994 | 0.791 | |||
| Mean-CRUJRA | [-] | 298. | 298. | 298. | 300. | -0.00281 | 0.675 | 0.274 | 0.741 | 0.815 | 0.967 | 1.00 | 0.868 | |||
| Mean-GSWP3 | [-] | 298. | 298. | 298. | 301. | 0.0705 | 0.762 | 0.302 | 0.734 | 0.739 | 0.963 | 1.00 | 0.835 | |||
| Mean-Princeton | [-] | 298. | 298. | 298. | 300. | 0.229 | 0.808 | 0.330 | 0.686 | 0.740 | 0.962 | 1.00 | 0.825 |
Download Data |
Period Mean (original grids) [K] |
Model Period Mean (intersection) [K] |
Benchmark Period Mean (intersection) [K] |
Model Period Mean (complement) [K] |
Benchmark Period Mean (complement) [K] |
Bias [K] |
RMSE [K] |
Phase Shift [months] |
Bias Score [1] |
RMSE Score [1] |
Seasonal Cycle Score [1] |
Spatial Distribution Score [1] |
Overall Score [1] |
|||
|---|---|---|---|---|---|---|---|---|---|---|---|---|---|---|---|---|
| Benchmark | [-] | 262. | ||||||||||||||
| CLM-CRUJRA | [-] | 258. | 261. | 262. | 261. | -0.889 | 1.69 | 0.00366 | 0.914 | 0.920 | 1.00 | 0.984 | 0.947 | |||
| CLM-GSWP3 | [-] | 258. | 262. | 262. | 261. | -0.0847 | 1.63 | 0.00987 | 0.923 | 0.915 | 0.999 | 0.982 | 0.947 | |||
| CLM-Princeton | [-] | 260. | 262. | 262. | 261. | -0.0489 | 1.36 | 0.00918 | 0.934 | 0.927 | 0.999 | 0.986 | 0.955 | |||
| ISBA-CTRIP-CRUJRA | [-] | 262. | 262. | 262. | 261. | 0.155 | 0.815 | 0.00365 | 0.946 | 0.975 | 1.00 | 1.00 | 0.979 | |||
| ISBA-CTRIP-GSWP3 | [-] | 262. | 262. | 262. | 0.468 | 1.76 | 0.0276 | 0.921 | 0.916 | 0.998 | 0.996 | 0.949 | ||||
| ISBA-CTRIP-Princeton | [-] | 262. | 262. | 262. | 261. | 0.0565 | 1.35 | 0.0107 | 0.940 | 0.930 | 0.999 | 1.00 | 0.960 | |||
| JSBACH-CRUJRA | [-] | 262. | 262. | 262. | 261. | 0.639 | 1.74 | 0.00321 | 0.923 | 0.914 | 1.00 | 1.00 | 0.950 | |||
| JSBACH-GSWP3 | [-] | 262. | 262. | 262. | 261. | 0.331 | 1.41 | 0.00359 | 0.934 | 0.930 | 1.00 | 0.999 | 0.959 | |||
| JSBACH-Princeton | [-] | 261. | 262. | 262. | 261. | 0.154 | 1.59 | 0.00375 | 0.938 | 0.912 | 1.00 | 0.999 | 0.952 | |||
| Mean-CRUJRA | [-] | 261. | 262. | 262. | 260. | -0.0735 | 0.992 | 0.00373 | 0.950 | 0.952 | 1.00 | 0.999 | 0.971 | |||
| Mean-GSWP3 | [-] | 262. | 262. | 262. | 0.265 | 1.48 | 0.0123 | 0.937 | 0.924 | 0.999 | 0.997 | 0.956 | ||||
| Mean-Princeton | [-] | 262. | 262. | 262. | 261. | -0.0149 | 1.27 | 0.0113 | 0.948 | 0.930 | 0.999 | 0.997 | 0.961 |
Download Data |
Period Mean (original grids) [K] |
Model Period Mean (intersection) [K] |
Benchmark Period Mean (intersection) [K] |
Model Period Mean (complement) [K] |
Benchmark Period Mean (complement) [K] |
Bias [K] |
RMSE [K] |
Phase Shift [months] |
Bias Score [1] |
RMSE Score [1] |
Seasonal Cycle Score [1] |
Spatial Distribution Score [1] |
Overall Score [1] |
|||
|---|---|---|---|---|---|---|---|---|---|---|---|---|---|---|---|---|
| Benchmark | [-] | 283. | ||||||||||||||
| CLM-CRUJRA | [-] | 283. | 283. | 283. | 288. | -0.103 | 1.25 | 0.104 | 0.870 | 0.902 | 0.992 | 0.998 | 0.933 | |||
| CLM-GSWP3 | [-] | 283. | 283. | 283. | 288. | 0.327 | 1.26 | 0.0916 | 0.869 | 0.901 | 0.993 | 0.999 | 0.933 | |||
| CLM-Princeton | [-] | 284. | 284. | 283. | 288. | 0.417 | 1.18 | 0.0940 | 0.866 | 0.918 | 0.993 | 0.999 | 0.939 | |||
| ISBA-CTRIP-CRUJRA | [-] | 283. | 283. | 283. | 288. | 0.0699 | 1.02 | 0.0737 | 0.868 | 0.957 | 0.994 | 1.00 | 0.955 | |||
| ISBA-CTRIP-GSWP3 | [-] | 283. | 283. | 283. | 0.166 | 1.30 | 0.102 | 0.857 | 0.917 | 0.992 | 0.999 | 0.936 | ||||
| ISBA-CTRIP-Princeton | [-] | 283. | 283. | 283. | 288. | 0.157 | 1.28 | 0.0903 | 0.859 | 0.920 | 0.993 | 0.999 | 0.938 | |||
| JSBACH-CRUJRA | [-] | 283. | 283. | 283. | 287. | 0.329 | 1.56 | 0.136 | 0.837 | 0.904 | 0.989 | 0.999 | 0.926 | |||
| JSBACH-GSWP3 | [-] | 283. | 283. | 283. | 287. | 0.209 | 1.34 | 0.102 | 0.850 | 0.923 | 0.991 | 1.00 | 0.937 | |||
| JSBACH-Princeton | [-] | 283. | 283. | 283. | 287. | 0.339 | 1.62 | 0.122 | 0.839 | 0.893 | 0.991 | 0.999 | 0.923 | |||
| Mean-CRUJRA | [-] | 283. | 283. | 283. | 286. | 0.103 | 1.02 | 0.0754 | 0.881 | 0.944 | 0.994 | 1.00 | 0.952 | |||
| Mean-GSWP3 | [-] | 283. | 283. | 283. | 286. | 0.254 | 1.13 | 0.0836 | 0.876 | 0.925 | 0.993 | 1.00 | 0.944 | |||
| Mean-Princeton | [-] | 284. | 284. | 283. | 286. | 0.310 | 1.16 | 0.0940 | 0.875 | 0.926 | 0.993 | 1.00 | 0.944 |
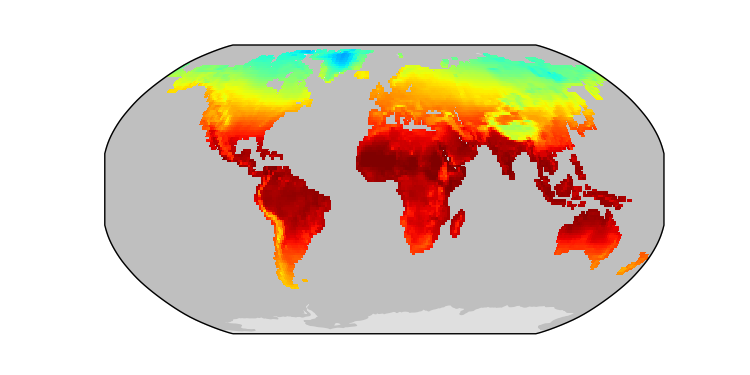
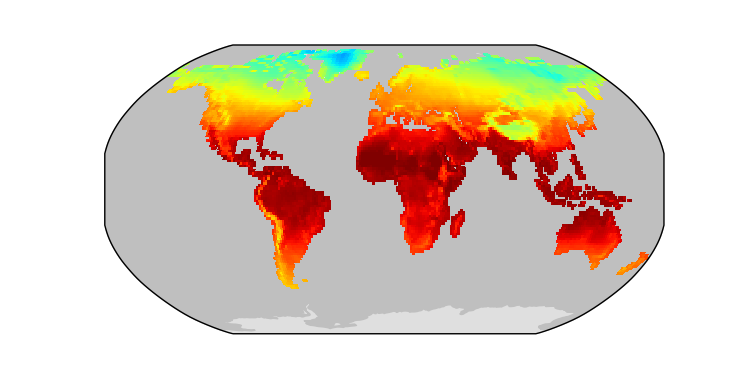
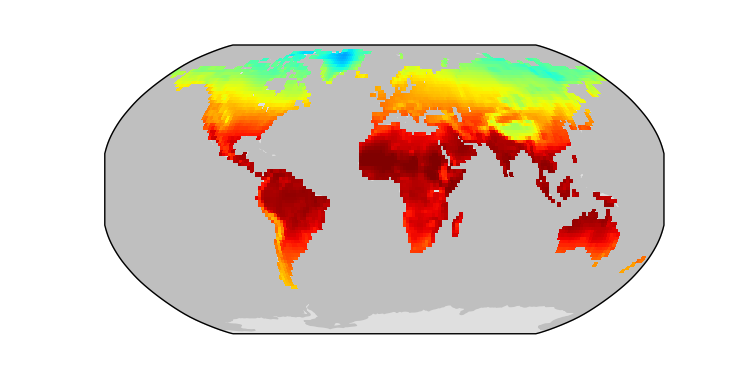
Temporally integrated period mean click to collapse contents


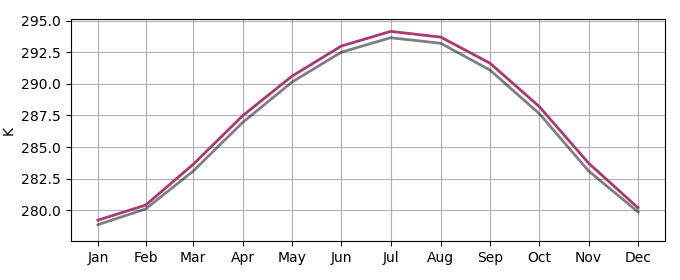
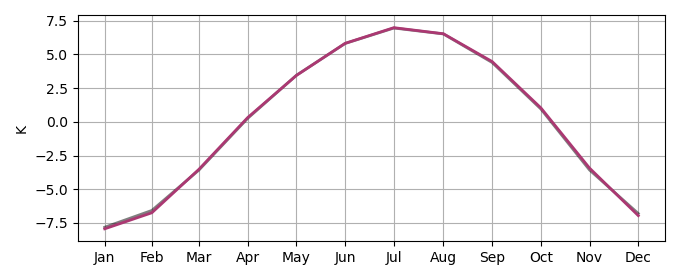
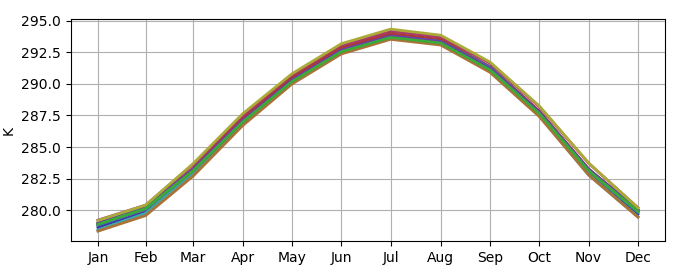
Spatially integrated regional mean click to collapse contents