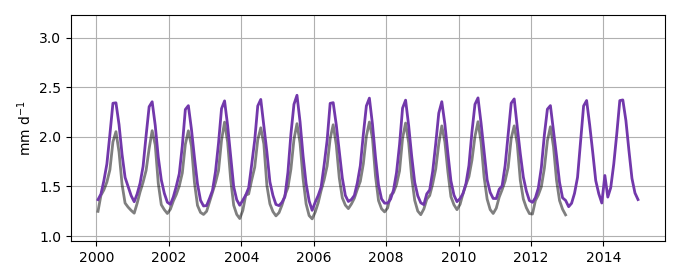
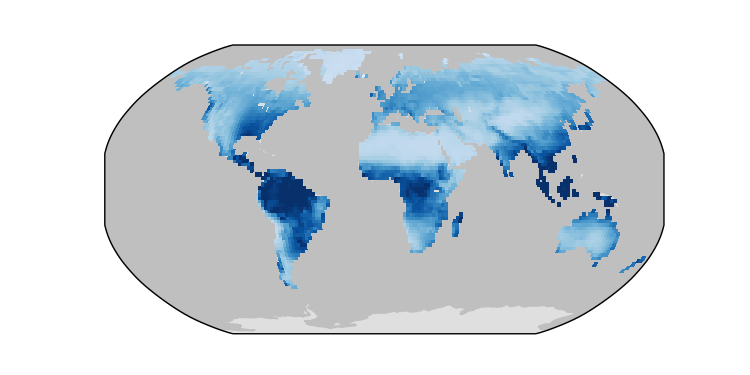
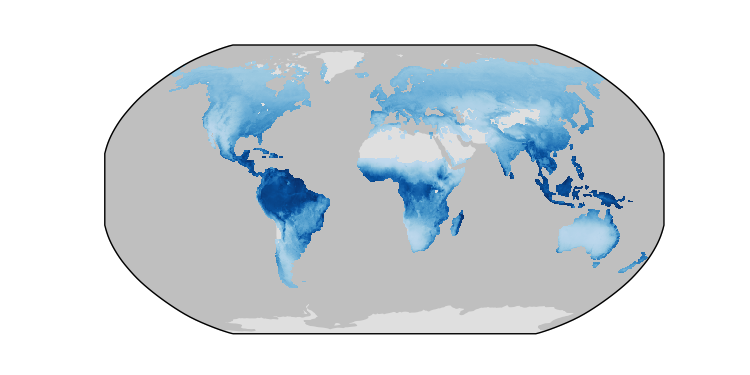
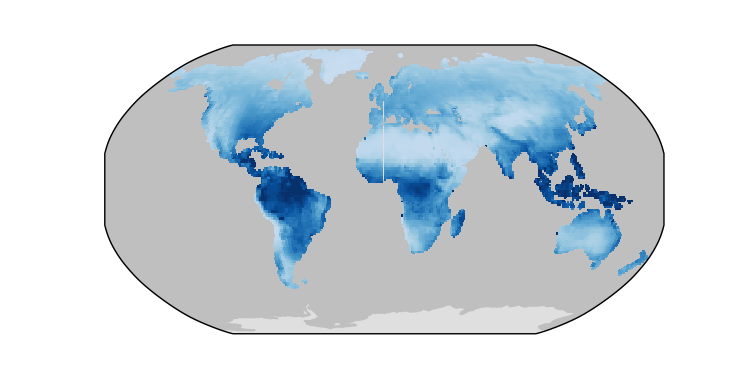
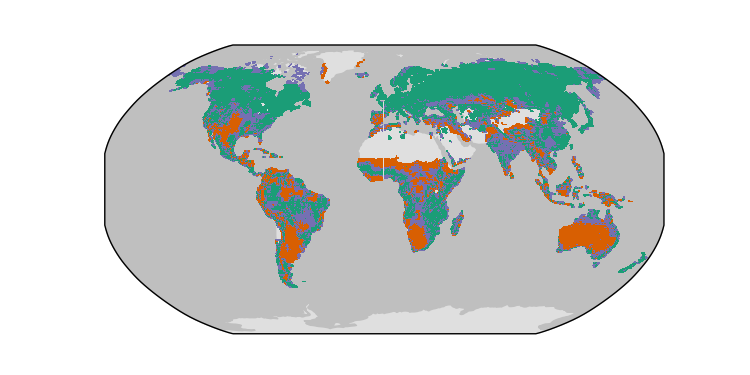
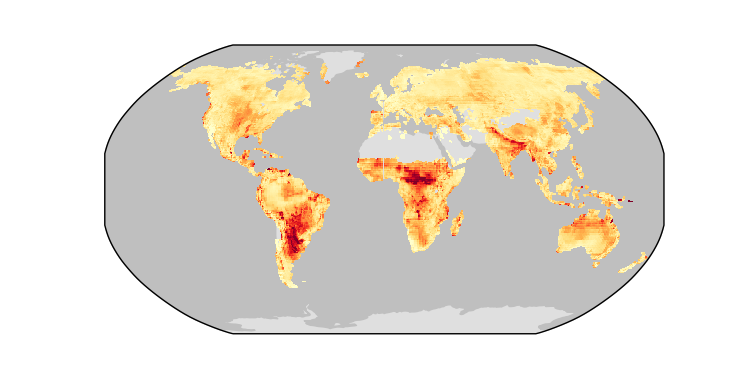
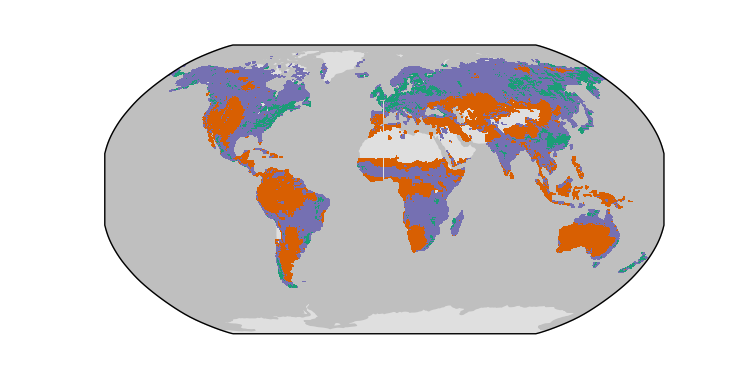
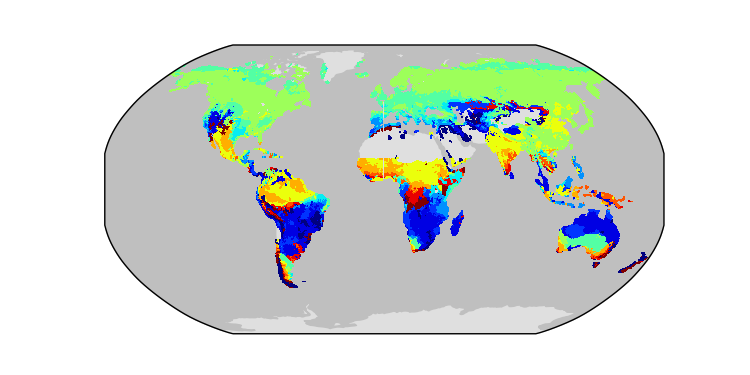
Evapotranspiration / MOD16A2 / 2000-2015 / global / Mean-GSWP3
Global - Land
CLM-CRUJRA
Download Data |
Period Mean (original grids) [mm d-1] |
Model Period Mean (intersection) [mm d-1] |
Benchmark Period Mean (intersection) [mm d-1] |
Model Period Mean (complement) [mm d-1] |
Benchmark Period Mean (complement) [mm d-1] |
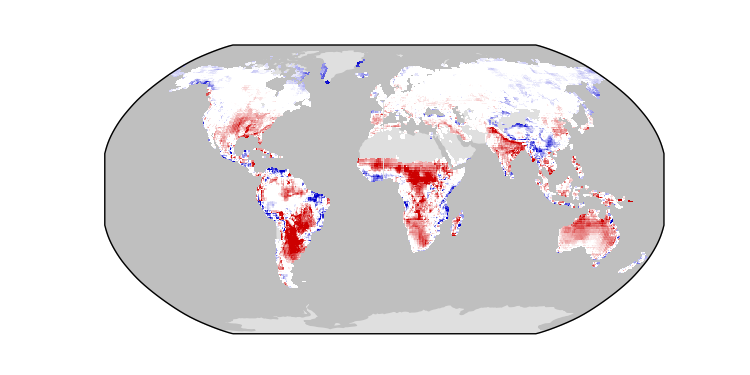
Bias [mm d-1] |
RMSE [mm d-1] |
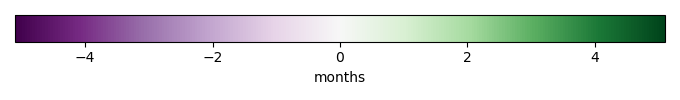
Phase Shift [months] |
Bias Score [1] |
RMSE Score [1] |
Seasonal Cycle Score [1] |
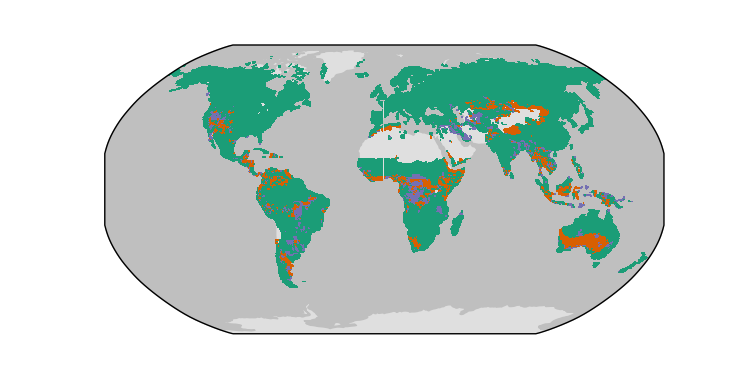
Spatial Distribution Score [1] |
Overall Score [1] |
|||
|---|---|---|---|---|---|---|---|---|---|---|---|---|---|---|---|---|
| Benchmark | [-] | 1.09 | ||||||||||||||
| CLM-CRUJRA | [-] | 0.932 | 0.953 | 1.09 | 0.706 | 1.13 | -0.133 | 0.464 | 0.410 | 0.791 | 0.622 | 0.967 | 0.989 | 0.798 | ||
| CLM-GSWP3 | [-] | 0.876 | 0.903 | 1.09 | 0.531 | 1.13 | -0.183 | 0.541 | 0.461 | 0.761 | 0.577 | 0.962 | 0.951 | 0.765 | ||
| CLM-Princeton | [-] | 0.785 | 0.803 | 1.09 | 0.574 | 1.13 | -0.283 | 0.498 | 0.354 | 0.696 | 0.640 | 0.968 | 0.987 | 0.786 | ||
| ISBA-CTRIP-CRUJRA | [-] | 0.980 | 1.00 | 1.09 | 0.753 | 0.899 | -0.0833 | 0.544 | 0.387 | 0.825 | 0.550 | 0.966 | 0.989 | 0.776 | ||
| ISBA-CTRIP-GSWP3 | [-] | 0.931 | 0.962 | 1.09 | 0.608 | 0.899 | -0.124 | 0.646 | 0.507 | 0.790 | 0.497 | 0.956 | 0.952 | 0.738 | ||
| ISBA-CTRIP-Princeton | [-] | 0.799 | 0.819 | 1.09 | 0.612 | 0.895 | -0.268 | 0.520 | 0.297 | 0.707 | 0.619 | 0.970 | 0.990 | 0.781 | ||
| JSBACH-CRUJRA | [-] | 1.67 | 1.75 | 1.09 | 0.952 | 1.09 | 0.200 | 0.663 | 0.532 | 0.710 | 0.509 | 0.957 | 0.711 | 0.679 | ||
| JSBACH-GSWP3 | [-] | 1.09 | 1.13 | 1.09 | 0.649 | 1.09 | 0.0427 | 0.735 | 0.636 | 0.765 | 0.449 | 0.949 | 0.775 | 0.677 | ||
| JSBACH-Princeton | [-] | 1.42 | 1.47 | 1.09 | 0.654 | 1.09 | 0.111 | 0.553 | 0.309 | 0.746 | 0.570 | 0.971 | 0.738 | 0.719 | ||
| Mean-CRUJRA | [-] | 1.04 | 1.08 | 1.09 | 0.799 | -0.00966 | 0.470 | 0.377 | 0.821 | 0.598 | 0.969 | 0.982 | 0.794 | |||
| Mean-GSWP3 | [-] | 0.947 | 0.994 | 1.09 | 0.626 | -0.0929 | 0.582 | 0.501 | 0.806 | 0.532 | 0.960 | 0.944 | 0.755 | |||
| Mean-Princeton | [-] | 0.901 | 0.937 | 1.09 | 0.671 | -0.150 | 0.414 | 0.221 | 0.796 | 0.655 | 0.979 | 0.989 | 0.815 |
Download Data |
Period Mean (original grids) [mm d-1] |
Model Period Mean (intersection) [mm d-1] |
Benchmark Period Mean (intersection) [mm d-1] |
Model Period Mean (complement) [mm d-1] |
Benchmark Period Mean (complement) [mm d-1] |
Bias [mm d-1] |
RMSE [mm d-1] |
Phase Shift [months] |
Bias Score [1] |
RMSE Score [1] |
Seasonal Cycle Score [1] |
Spatial Distribution Score [1] |
Overall Score [1] |
|||
|---|---|---|---|---|---|---|---|---|---|---|---|---|---|---|---|---|
| Benchmark | [-] | 1.56 | ||||||||||||||
| CLM-CRUJRA | [-] | 1.49 | 1.58 | 1.56 | 0.851 | 2.44 | 0.0227 | 0.733 | 1.47 | 0.585 | 0.428 | 0.739 | 0.971 | 0.630 | ||
| CLM-GSWP3 | [-] | 1.43 | 1.52 | 1.56 | 0.789 | 2.44 | -0.0327 | 0.774 | 1.43 | 0.563 | 0.413 | 0.775 | 0.965 | 0.626 | ||
| CLM-Princeton | [-] | 1.34 | 1.41 | 1.56 | 0.784 | 2.44 | -0.144 | 0.804 | 1.49 | 0.498 | 0.433 | 0.747 | 0.930 | 0.608 | ||
| ISBA-CTRIP-CRUJRA | [-] | 1.62 | 1.80 | 1.56 | 1.07 | 2.57 | 0.247 | 0.766 | 1.18 | 0.585 | 0.421 | 0.803 | 0.965 | 0.639 | ||
| ISBA-CTRIP-GSWP3 | [-] | 1.53 | 1.72 | 1.56 | 0.980 | 2.57 | 0.158 | 0.818 | 1.22 | 0.590 | 0.380 | 0.809 | 0.974 | 0.627 | ||
| ISBA-CTRIP-Princeton | [-] | 1.38 | 1.52 | 1.56 | 0.960 | 2.57 | -0.0426 | 0.794 | 1.28 | 0.522 | 0.422 | 0.778 | 0.961 | 0.621 | ||
| JSBACH-CRUJRA | [-] | 2.40 | 2.84 | 1.51 | 0.576 | 2.32 | 0.521 | 0.976 | 1.23 | 0.448 | 0.378 | 0.813 | 0.896 | 0.582 | ||
| JSBACH-GSWP3 | [-] | 1.76 | 1.96 | 1.51 | 0.615 | 2.32 | 0.441 | 1.01 | 1.38 | 0.483 | 0.326 | 0.781 | 0.910 | 0.565 | ||
| JSBACH-Princeton | [-] | 2.22 | 2.63 | 1.51 | 0.509 | 2.32 | 0.414 | 0.898 | 1.21 | 0.517 | 0.390 | 0.805 | 0.920 | 0.604 | ||
| Mean-CRUJRA | [-] | 1.63 | 1.81 | 1.56 | 1.12 | 1.54 | 0.253 | 0.701 | 1.18 | 0.600 | 0.452 | 0.813 | 0.975 | 0.658 | ||
| Mean-GSWP3 | [-] | 1.55 | 1.74 | 1.56 | 1.04 | 1.54 | 0.179 | 0.752 | 1.23 | 0.611 | 0.412 | 0.808 | 0.979 | 0.645 | ||
| Mean-Princeton | [-] | 1.47 | 1.62 | 1.56 | 1.03 | 1.53 | 0.0636 | 0.689 | 1.21 | 0.574 | 0.463 | 0.797 | 0.978 | 0.655 |
Download Data |
Period Mean (original grids) [mm d-1] |
Model Period Mean (intersection) [mm d-1] |
Benchmark Period Mean (intersection) [mm d-1] |
Model Period Mean (complement) [mm d-1] |
Benchmark Period Mean (complement) [mm d-1] |
Bias [mm d-1] |
RMSE [mm d-1] |
Phase Shift [months] |
Bias Score [1] |
RMSE Score [1] |
Seasonal Cycle Score [1] |
Spatial Distribution Score [1] |
Overall Score [1] |
|||
|---|---|---|---|---|---|---|---|---|---|---|---|---|---|---|---|---|
| Benchmark | [-] | 0.531 | ||||||||||||||
| CLM-CRUJRA | [-] | 0.614 | 0.950 | 0.524 | 0.238 | 1.18 | 0.427 | 0.775 | 1.90 | 0.476 | 0.346 | 0.756 | 0.934 | 0.572 | ||
| CLM-GSWP3 | [-] | 0.592 | 0.940 | 0.524 | 0.205 | 1.18 | 0.417 | 0.770 | 1.93 | 0.478 | 0.337 | 0.751 | 0.937 | 0.568 | ||
| CLM-Princeton | [-] | 0.555 | 0.881 | 0.529 | 0.194 | 1.18 | 0.352 | 0.735 | 1.92 | 0.510 | 0.336 | 0.757 | 0.936 | 0.575 | ||
| ISBA-CTRIP-CRUJRA | [-] | 0.672 | 1.01 | 0.525 | 0.286 | 1.90 | 0.492 | 0.851 | 1.57 | 0.447 | 0.322 | 0.799 | 0.900 | 0.558 | ||
| ISBA-CTRIP-GSWP3 | [-] | 0.647 | 1.00 | 0.525 | 0.241 | 1.90 | 0.482 | 0.896 | 1.54 | 0.450 | 0.296 | 0.818 | 0.896 | 0.551 | ||
| ISBA-CTRIP-Princeton | [-] | 0.618 | 0.954 | 0.530 | 0.233 | 1.91 | 0.430 | 0.831 | 1.61 | 0.474 | 0.313 | 0.805 | 0.896 | 0.560 | ||
| JSBACH-CRUJRA | [-] | 0.680 | 1.13 | 0.510 | 0.168 | 0.969 | 0.515 | 0.954 | 1.59 | 0.422 | 0.266 | 0.783 | 0.849 | 0.517 | ||
| JSBACH-GSWP3 | [-] | 0.634 | 1.03 | 0.510 | 0.180 | 0.969 | 0.523 | 0.946 | 1.67 | 0.421 | 0.274 | 0.785 | 0.857 | 0.522 | ||
| JSBACH-Princeton | [-] | 0.631 | 1.07 | 0.510 | 0.139 | 0.969 | 0.443 | 0.894 | 1.64 | 0.450 | 0.271 | 0.789 | 0.855 | 0.527 | ||
| Mean-CRUJRA | [-] | 0.654 | 0.997 | 0.526 | 0.281 | 0.323 | 0.470 | 0.794 | 1.65 | 0.452 | 0.354 | 0.789 | 0.931 | 0.576 | ||
| Mean-GSWP3 | [-] | 0.633 | 0.992 | 0.526 | 0.240 | 0.323 | 0.465 | 0.804 | 1.65 | 0.453 | 0.344 | 0.800 | 0.935 | 0.575 | ||
| Mean-Princeton | [-] | 0.600 | 0.935 | 0.532 | 0.234 | 0.311 | 0.403 | 0.749 | 1.63 | 0.481 | 0.353 | 0.803 | 0.934 | 0.585 |
Download Data |
Period Mean (original grids) [mm d-1] |
Model Period Mean (intersection) [mm d-1] |
Benchmark Period Mean (intersection) [mm d-1] |
Model Period Mean (complement) [mm d-1] |
Benchmark Period Mean (complement) [mm d-1] |
Bias [mm d-1] |
RMSE [mm d-1] |
Phase Shift [months] |
Bias Score [1] |
RMSE Score [1] |
Seasonal Cycle Score [1] |
Spatial Distribution Score [1] |
Overall Score [1] |
|||
|---|---|---|---|---|---|---|---|---|---|---|---|---|---|---|---|---|
| Benchmark | [-] | 0.532 | ||||||||||||||
| CLM-CRUJRA | [-] | 0.549 | 0.637 | 0.532 | 0.401 | 0.856 | 0.112 | 0.679 | 3.16 | 0.545 | 0.153 | 0.535 | 0.898 | 0.456 | ||
| CLM-GSWP3 | [-] | 0.508 | 0.624 | 0.532 | 0.308 | 0.856 | 0.101 | 0.671 | 3.00 | 0.530 | 0.158 | 0.563 | 0.853 | 0.452 | ||
| CLM-Princeton | [-] | 0.507 | 0.603 | 0.532 | 0.340 | 0.855 | 0.0774 | 0.693 | 3.12 | 0.545 | 0.148 | 0.541 | 0.895 | 0.455 | ||
| ISBA-CTRIP-CRUJRA | [-] | 0.560 | 0.655 | 0.532 | 0.377 | 0.118 | 0.622 | 2.47 | 0.535 | 0.182 | 0.655 | 0.936 | 0.498 | |||
| ISBA-CTRIP-GSWP3 | [-] | 0.507 | 0.625 | 0.532 | 0.270 | 0.0881 | 0.647 | 2.33 | 0.543 | 0.173 | 0.675 | 0.866 | 0.486 | |||
| ISBA-CTRIP-Princeton | [-] | 0.503 | 0.602 | 0.532 | 0.306 | 0.0639 | 0.649 | 2.53 | 0.544 | 0.169 | 0.646 | 0.923 | 0.490 | |||
| JSBACH-CRUJRA | [-] | 0.854 | 0.754 | 0.525 | 0.930 | 0.784 | 0.0904 | 0.530 | 2.51 | 0.544 | 0.215 | 0.642 | 0.949 | 0.513 | ||
| JSBACH-GSWP3 | [-] | 0.493 | 0.615 | 0.525 | 0.247 | 0.784 | 0.0836 | 0.579 | 2.47 | 0.539 | 0.190 | 0.653 | 0.914 | 0.497 | ||
| JSBACH-Princeton | [-] | 0.818 | 0.712 | 0.525 | 0.901 | 0.784 | 0.0572 | 0.547 | 2.58 | 0.550 | 0.206 | 0.626 | 0.942 | 0.506 | ||
| Mean-CRUJRA | [-] | 0.549 | 0.634 | 0.532 | 0.379 | 0.670 | 0.102 | 0.550 | 2.70 | 0.550 | 0.214 | 0.621 | 0.959 | 0.512 | ||
| Mean-GSWP3 | [-] | 0.506 | 0.618 | 0.532 | 0.279 | 0.670 | 0.0861 | 0.572 | 2.49 | 0.553 | 0.201 | 0.654 | 0.941 | 0.510 | ||
| Mean-Princeton | [-] | 0.499 | 0.592 | 0.532 | 0.313 | 0.660 | 0.0595 | 0.566 | 2.76 | 0.554 | 0.203 | 0.608 | 0.952 | 0.504 |
Download Data |
Period Mean (original grids) [mm d-1] |
Model Period Mean (intersection) [mm d-1] |
Benchmark Period Mean (intersection) [mm d-1] |
Model Period Mean (complement) [mm d-1] |
Benchmark Period Mean (complement) [mm d-1] |
Bias [mm d-1] |
RMSE [mm d-1] |
Phase Shift [months] |
Bias Score [1] |
RMSE Score [1] |
Seasonal Cycle Score [1] |
Spatial Distribution Score [1] |
Overall Score [1] |
|||
|---|---|---|---|---|---|---|---|---|---|---|---|---|---|---|---|---|
| Benchmark | [-] | 1.94 | ||||||||||||||
| CLM-CRUJRA | [-] | 1.81 | 1.97 | 1.97 | 1.46 | 1.31 | 0.0134 | 0.540 | 1.34 | 0.570 | 0.446 | 0.738 | 0.986 | 0.637 | ||
| CLM-GSWP3 | [-] | 1.60 | 1.75 | 1.97 | 1.14 | 1.31 | -0.218 | 0.563 | 1.18 | 0.588 | 0.443 | 0.787 | 0.975 | 0.647 | ||
| CLM-Princeton | [-] | 1.42 | 1.56 | 1.97 | 1.15 | 1.31 | -0.411 | 0.621 | 1.30 | 0.438 | 0.486 | 0.781 | 0.963 | 0.631 | ||
| ISBA-CTRIP-CRUJRA | [-] | 2.09 | 2.28 | 1.94 | 2.14 | 1.42 | 0.374 | 0.728 | 1.43 | 0.459 | 0.410 | 0.701 | 0.936 | 0.583 | ||
| ISBA-CTRIP-GSWP3 | [-] | 1.71 | 1.85 | 1.94 | 1.81 | 1.42 | -0.0657 | 0.634 | 1.20 | 0.563 | 0.413 | 0.771 | 0.967 | 0.626 | ||
| ISBA-CTRIP-Princeton | [-] | 1.49 | 1.56 | 1.94 | 1.67 | 1.41 | -0.360 | 0.778 | 1.46 | 0.406 | 0.435 | 0.729 | 0.966 | 0.594 | ||
| JSBACH-CRUJRA | [-] | 4.16 | 4.19 | 2.01 | 2.79 | 1.69 | 1.19 | 1.45 | 1.67 | 0.189 | 0.284 | 0.676 | 0.915 | 0.470 | ||
| JSBACH-GSWP3 | [-] | 2.27 | 2.56 | 2.01 | 1.93 | 1.69 | 0.548 | 1.18 | 1.57 | 0.342 | 0.258 | 0.675 | 0.860 | 0.479 | ||
| JSBACH-Princeton | [-] | 3.10 | 3.37 | 2.01 | 1.94 | 1.69 | 0.748 | 1.06 | 1.62 | 0.298 | 0.336 | 0.735 | 0.975 | 0.536 | ||
| Mean-CRUJRA | [-] | 2.36 | 2.39 | 1.94 | 2.15 | 0.454 | 0.730 | 1.36 | 0.447 | 0.428 | 0.725 | 0.978 | 0.601 | |||
| Mean-GSWP3 | [-] | 2.02 | 2.01 | 1.94 | 1.83 | 0.0682 | 0.609 | 1.18 | 0.549 | 0.427 | 0.767 | 0.976 | 0.629 | |||
| Mean-Princeton | [-] | 1.88 | 1.86 | 1.94 | 1.76 | -0.0726 | 0.589 | 1.31 | 0.512 | 0.460 | 0.772 | 0.960 | 0.633 |
Download Data |
Period Mean (original grids) [mm d-1] |
Model Period Mean (intersection) [mm d-1] |
Benchmark Period Mean (intersection) [mm d-1] |
Model Period Mean (complement) [mm d-1] |
Benchmark Period Mean (complement) [mm d-1] |
Bias [mm d-1] |
RMSE [mm d-1] |
Phase Shift [months] |
Bias Score [1] |
RMSE Score [1] |
Seasonal Cycle Score [1] |
Spatial Distribution Score [1] |
Overall Score [1] |
|||
|---|---|---|---|---|---|---|---|---|---|---|---|---|---|---|---|---|
| Benchmark | [-] | 1.65 | ||||||||||||||
| CLM-CRUJRA | [-] | 1.53 | 1.52 | 1.65 | 1.60 | 1.57 | -0.133 | 0.523 | 0.511 | 0.780 | 0.644 | 0.947 | 0.976 | 0.798 | ||
| CLM-GSWP3 | [-] | 1.43 | 1.43 | 1.65 | 1.44 | 1.57 | -0.226 | 0.591 | 0.524 | 0.733 | 0.625 | 0.944 | 0.975 | 0.780 | ||
| CLM-Princeton | [-] | 1.35 | 1.34 | 1.65 | 1.42 | 1.57 | -0.308 | 0.602 | 0.511 | 0.696 | 0.631 | 0.942 | 0.954 | 0.771 | ||
| ISBA-CTRIP-CRUJRA | [-] | 1.80 | 1.80 | 1.65 | 1.91 | 1.87 | 0.145 | 0.665 | 0.609 | 0.745 | 0.568 | 0.939 | 0.902 | 0.745 | ||
| ISBA-CTRIP-GSWP3 | [-] | 1.70 | 1.70 | 1.65 | 1.74 | 1.87 | 0.0539 | 0.703 | 0.640 | 0.740 | 0.555 | 0.935 | 0.923 | 0.741 | ||
| ISBA-CTRIP-Princeton | [-] | 1.56 | 1.55 | 1.65 | 1.65 | 1.87 | -0.0990 | 0.626 | 0.535 | 0.750 | 0.588 | 0.941 | 0.962 | 0.766 | ||
| JSBACH-CRUJRA | [-] | 3.01 | 2.94 | 1.64 | 2.68 | 1.81 | 0.603 | 1.04 | 0.812 | 0.543 | 0.484 | 0.916 | 0.731 | 0.631 | ||
| JSBACH-GSWP3 | [-] | 2.16 | 2.15 | 1.64 | 2.33 | 1.81 | 0.507 | 0.999 | 0.761 | 0.589 | 0.484 | 0.915 | 0.798 | 0.654 | ||
| JSBACH-Princeton | [-] | 2.80 | 2.75 | 1.64 | 2.52 | 1.81 | 0.548 | 0.952 | 0.652 | 0.564 | 0.514 | 0.928 | 0.758 | 0.656 | ||
| Mean-CRUJRA | [-] | 1.83 | 1.84 | 1.65 | 1.91 | 1.54 | 0.190 | 0.596 | 0.592 | 0.751 | 0.607 | 0.943 | 0.948 | 0.771 | ||
| Mean-GSWP3 | [-] | 1.73 | 1.75 | 1.65 | 1.74 | 1.54 | 0.0966 | 0.626 | 0.587 | 0.754 | 0.594 | 0.939 | 0.967 | 0.770 | ||
| Mean-Princeton | [-] | 1.66 | 1.68 | 1.65 | 1.70 | 1.54 | 0.0293 | 0.535 | 0.479 | 0.788 | 0.626 | 0.949 | 0.975 | 0.793 |
Download Data |
Period Mean (original grids) [mm d-1] |
Model Period Mean (intersection) [mm d-1] |
Benchmark Period Mean (intersection) [mm d-1] |
Model Period Mean (complement) [mm d-1] |
Benchmark Period Mean (complement) [mm d-1] |
Bias [mm d-1] |
RMSE [mm d-1] |
Phase Shift [months] |
Bias Score [1] |
RMSE Score [1] |
Seasonal Cycle Score [1] |
Spatial Distribution Score [1] |
Overall Score [1] |
|||
|---|---|---|---|---|---|---|---|---|---|---|---|---|---|---|---|---|
| Benchmark | [-] | 3.66 | ||||||||||||||
| CLM-CRUJRA | [-] | 3.38 | 3.37 | 3.66 | 3.55 | 3.95 | -0.287 | 0.740 | 3.49 | 0.366 | 0.266 | 0.409 | 0.967 | 0.455 | ||
| CLM-GSWP3 | [-] | 3.25 | 3.24 | 3.66 | 3.50 | 3.95 | -0.418 | 0.746 | 2.18 | 0.324 | 0.280 | 0.675 | 0.894 | 0.491 | ||
| CLM-Princeton | [-] | 2.74 | 2.70 | 3.65 | 3.37 | 3.95 | -0.959 | 1.15 | 2.32 | 0.124 | 0.355 | 0.636 | 0.992 | 0.493 | ||
| ISBA-CTRIP-CRUJRA | [-] | 4.25 | 4.24 | 3.66 | 4.20 | 3.70 | 0.575 | 0.872 | 3.23 | 0.343 | 0.267 | 0.466 | 0.961 | 0.461 | ||
| ISBA-CTRIP-GSWP3 | [-] | 4.01 | 3.93 | 3.66 | 4.25 | 3.70 | 0.268 | 0.800 | 1.90 | 0.439 | 0.219 | 0.716 | 0.837 | 0.486 | ||
| ISBA-CTRIP-Princeton | [-] | 2.99 | 2.84 | 3.66 | 4.04 | 3.71 | -0.824 | 1.12 | 2.15 | 0.161 | 0.321 | 0.660 | 0.815 | 0.456 | ||
| JSBACH-CRUJRA | [-] | 4.82 | 4.85 | 3.64 | 5.30 | 3.78 | 1.21 | 1.36 | 2.91 | 0.0931 | 0.280 | 0.528 | 0.991 | 0.434 | ||
| JSBACH-GSWP3 | [-] | 4.49 | 4.50 | 3.64 | 5.09 | 3.78 | 0.851 | 1.26 | 1.94 | 0.240 | 0.154 | 0.710 | 0.717 | 0.395 | ||
| JSBACH-Princeton | [-] | 4.05 | 4.08 | 3.64 | 4.59 | 3.78 | 0.526 | 0.786 | 1.85 | 0.409 | 0.328 | 0.718 | 0.972 | 0.551 | ||
| Mean-CRUJRA | [-] | 4.10 | 4.10 | 3.66 | 4.15 | 0.439 | 0.755 | 3.12 | 0.401 | 0.289 | 0.492 | 0.984 | 0.491 | |||
| Mean-GSWP3 | [-] | 3.87 | 3.86 | 3.66 | 4.19 | 0.196 | 0.683 | 1.88 | 0.537 | 0.260 | 0.719 | 0.973 | 0.550 | |||
| Mean-Princeton | [-] | 3.29 | 3.19 | 3.66 | 4.08 | -0.471 | 0.814 | 2.19 | 0.265 | 0.364 | 0.652 | 0.966 | 0.522 |
Download Data |
Period Mean (original grids) [mm d-1] |
Model Period Mean (intersection) [mm d-1] |
Benchmark Period Mean (intersection) [mm d-1] |
Model Period Mean (complement) [mm d-1] |
Benchmark Period Mean (complement) [mm d-1] |
Bias [mm d-1] |
RMSE [mm d-1] |
Phase Shift [months] |
Bias Score [1] |
RMSE Score [1] |
Seasonal Cycle Score [1] |
Spatial Distribution Score [1] |
Overall Score [1] |
|||
|---|---|---|---|---|---|---|---|---|---|---|---|---|---|---|---|---|
| Benchmark | [-] | 2.56 | ||||||||||||||
| CLM-CRUJRA | [-] | 2.60 | 2.57 | 2.55 | 2.93 | 3.42 | 0.0217 | 0.999 | 2.07 | 0.513 | 0.376 | 0.653 | 0.839 | 0.551 | ||
| CLM-GSWP3 | [-] | 2.52 | 2.48 | 2.55 | 2.94 | 3.42 | -0.0613 | 1.04 | 2.04 | 0.500 | 0.362 | 0.683 | 0.853 | 0.552 | ||
| CLM-Princeton | [-] | 2.37 | 2.33 | 2.55 | 2.81 | 3.42 | -0.220 | 1.15 | 2.30 | 0.421 | 0.369 | 0.629 | 0.714 | 0.501 | ||
| ISBA-CTRIP-CRUJRA | [-] | 3.03 | 2.98 | 2.55 | 3.41 | 3.14 | 0.426 | 0.972 | 1.46 | 0.532 | 0.396 | 0.767 | 0.975 | 0.614 | ||
| ISBA-CTRIP-GSWP3 | [-] | 2.84 | 2.80 | 2.55 | 3.21 | 3.14 | 0.253 | 1.02 | 1.69 | 0.535 | 0.347 | 0.732 | 0.976 | 0.587 | ||
| ISBA-CTRIP-Princeton | [-] | 2.56 | 2.49 | 2.56 | 3.19 | 3.14 | -0.0670 | 1.07 | 2.00 | 0.459 | 0.367 | 0.674 | 0.808 | 0.535 | ||
| JSBACH-CRUJRA | [-] | 3.53 | 3.51 | 2.50 | 3.72 | 3.12 | 0.921 | 1.39 | 1.43 | 0.366 | 0.349 | 0.783 | 0.977 | 0.565 | ||
| JSBACH-GSWP3 | [-] | 3.35 | 3.32 | 2.50 | 3.75 | 3.12 | 0.816 | 1.44 | 1.99 | 0.406 | 0.279 | 0.685 | 0.982 | 0.526 | ||
| JSBACH-Princeton | [-] | 3.36 | 3.33 | 2.50 | 3.48 | 3.12 | 0.779 | 1.32 | 1.71 | 0.439 | 0.340 | 0.723 | 0.981 | 0.565 | ||
| Mean-CRUJRA | [-] | 3.03 | 2.98 | 2.55 | 3.35 | 2.79 | 0.430 | 0.930 | 1.39 | 0.545 | 0.420 | 0.783 | 0.955 | 0.625 | ||
| Mean-GSWP3 | [-] | 2.92 | 2.86 | 2.55 | 3.27 | 2.79 | 0.313 | 0.981 | 1.70 | 0.551 | 0.372 | 0.730 | 0.947 | 0.594 | ||
| Mean-Princeton | [-] | 2.76 | 2.69 | 2.56 | 3.22 | 2.77 | 0.138 | 0.960 | 1.76 | 0.509 | 0.409 | 0.711 | 0.839 | 0.576 |
Download Data |
Period Mean (original grids) [mm d-1] |
Model Period Mean (intersection) [mm d-1] |
Benchmark Period Mean (intersection) [mm d-1] |
Model Period Mean (complement) [mm d-1] |
Benchmark Period Mean (complement) [mm d-1] |
Bias [mm d-1] |
RMSE [mm d-1] |
Phase Shift [months] |
Bias Score [1] |
RMSE Score [1] |
Seasonal Cycle Score [1] |
Spatial Distribution Score [1] |
Overall Score [1] |
|||
|---|---|---|---|---|---|---|---|---|---|---|---|---|---|---|---|---|
| Benchmark | [-] | 0.852 | ||||||||||||||
| CLM-CRUJRA | [-] | 0.816 | 0.653 | 0.851 | 0.258 | 0.750 | -0.199 | 0.460 | 0.402 | 0.766 | 0.609 | 0.973 | 0.988 | 0.789 | ||
| CLM-GSWP3 | [-] | 0.805 | 0.619 | 0.851 | 0.123 | 0.750 | -0.233 | 0.561 | 0.543 | 0.733 | 0.552 | 0.961 | 0.975 | 0.755 | ||
| CLM-Princeton | [-] | 0.759 | 0.573 | 0.852 | 0.237 | 0.744 | -0.279 | 0.459 | 0.380 | 0.700 | 0.642 | 0.974 | 0.988 | 0.789 | ||
| ISBA-CTRIP-CRUJRA | [-] | 0.537 | 0.693 | 0.851 | 0.219 | 0.741 | -0.157 | 0.468 | 0.393 | 0.810 | 0.581 | 0.973 | 0.979 | 0.785 | ||
| ISBA-CTRIP-GSWP3 | [-] | 0.493 | 0.665 | 0.851 | 0.141 | 0.741 | -0.186 | 0.573 | 0.505 | 0.780 | 0.516 | 0.964 | 0.959 | 0.747 | ||
| ISBA-CTRIP-Princeton | [-] | 0.464 | 0.574 | 0.852 | 0.241 | 0.737 | -0.276 | 0.459 | 0.331 | 0.700 | 0.637 | 0.977 | 0.990 | 0.788 | ||
| JSBACH-CRUJRA | [-] | 0.564 | 0.749 | 0.854 | 0.283 | 0.741 | -0.0131 | 0.474 | 0.516 | 0.840 | 0.565 | 0.960 | 0.870 | 0.760 | ||
| JSBACH-GSWP3 | [-] | 0.568 | 0.707 | 0.854 | 0.0722 | 0.741 | -0.147 | 0.572 | 0.602 | 0.780 | 0.523 | 0.956 | 0.880 | 0.732 | ||
| JSBACH-Princeton | [-] | 0.462 | 0.645 | 0.854 | 0.190 | 0.741 | -0.0882 | 0.442 | 0.365 | 0.825 | 0.595 | 0.973 | 0.837 | 0.765 | ||
| Mean-CRUJRA | [-] | 0.568 | 0.725 | 0.851 | 0.264 | -0.126 | 0.383 | 0.382 | 0.828 | 0.643 | 0.974 | 0.984 | 0.815 | |||
| Mean-GSWP3 | [-] | 0.480 | 0.661 | 0.851 | 0.126 | -0.190 | 0.514 | 0.484 | 0.772 | 0.565 | 0.966 | 0.979 | 0.769 | |||
| Mean-Princeton | [-] | 0.505 | 0.635 | 0.852 | 0.254 | -0.216 | 0.386 | 0.311 | 0.757 | 0.673 | 0.979 | 0.983 | 0.813 |
Download Data |
Period Mean (original grids) [mm d-1] |
Model Period Mean (intersection) [mm d-1] |
Benchmark Period Mean (intersection) [mm d-1] |
Model Period Mean (complement) [mm d-1] |
Benchmark Period Mean (complement) [mm d-1] |
Bias [mm d-1] |
RMSE [mm d-1] |
Phase Shift [months] |
Bias Score [1] |
RMSE Score [1] |
Seasonal Cycle Score [1] |
Spatial Distribution Score [1] |
Overall Score [1] |
|||
|---|---|---|---|---|---|---|---|---|---|---|---|---|---|---|---|---|
| Benchmark | [-] | 1.10 | ||||||||||||||
| CLM-CRUJRA | [-] | 1.19 | 1.18 | 1.10 | 1.19 | 1.52 | 0.0858 | 0.757 | 1.13 | 0.663 | 0.363 | 0.883 | 0.976 | 0.650 | ||
| CLM-GSWP3 | [-] | 1.18 | 1.17 | 1.10 | 1.13 | 1.52 | 0.0688 | 0.779 | 1.12 | 0.644 | 0.358 | 0.880 | 0.968 | 0.642 | ||
| CLM-Princeton | [-] | 1.13 | 1.12 | 1.10 | 1.13 | 1.52 | 0.0188 | 0.774 | 1.15 | 0.656 | 0.356 | 0.876 | 0.961 | 0.641 | ||
| ISBA-CTRIP-CRUJRA | [-] | 1.33 | 1.32 | 1.10 | 1.32 | 1.39 | 0.213 | 0.751 | 0.932 | 0.606 | 0.370 | 0.911 | 0.951 | 0.642 | ||
| ISBA-CTRIP-GSWP3 | [-] | 1.31 | 1.30 | 1.10 | 1.21 | 1.39 | 0.196 | 0.798 | 0.972 | 0.602 | 0.354 | 0.906 | 0.950 | 0.633 | ||
| ISBA-CTRIP-Princeton | [-] | 1.24 | 1.23 | 1.10 | 1.22 | 1.39 | 0.123 | 0.745 | 0.938 | 0.634 | 0.370 | 0.908 | 0.969 | 0.650 | ||
| JSBACH-CRUJRA | [-] | 1.67 | 1.68 | 1.08 | 1.35 | 1.46 | 0.262 | 0.785 | 1.03 | 0.563 | 0.327 | 0.891 | 0.909 | 0.603 | ||
| JSBACH-GSWP3 | [-] | 1.39 | 1.40 | 1.08 | 1.06 | 1.46 | 0.318 | 0.867 | 1.04 | 0.527 | 0.317 | 0.885 | 0.901 | 0.589 | ||
| JSBACH-Princeton | [-] | 1.67 | 1.66 | 1.08 | 1.33 | 1.46 | 0.231 | 0.772 | 0.993 | 0.576 | 0.337 | 0.892 | 0.913 | 0.611 | ||
| Mean-CRUJRA | [-] | 1.30 | 1.28 | 1.10 | 1.32 | 1.26 | 0.186 | 0.670 | 0.944 | 0.625 | 0.404 | 0.910 | 0.974 | 0.664 | ||
| Mean-GSWP3 | [-] | 1.30 | 1.29 | 1.10 | 1.23 | 1.26 | 0.191 | 0.728 | 0.950 | 0.613 | 0.384 | 0.905 | 0.976 | 0.653 | ||
| Mean-Princeton | [-] | 1.23 | 1.22 | 1.10 | 1.24 | 1.25 | 0.122 | 0.656 | 0.931 | 0.650 | 0.411 | 0.909 | 0.979 | 0.672 |
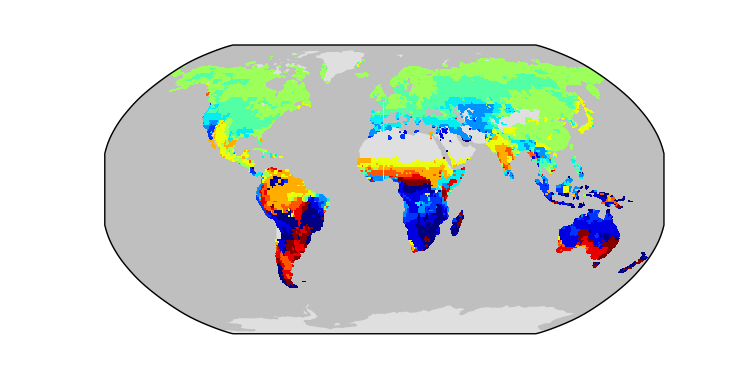
Temporally integrated period mean click to collapse contents


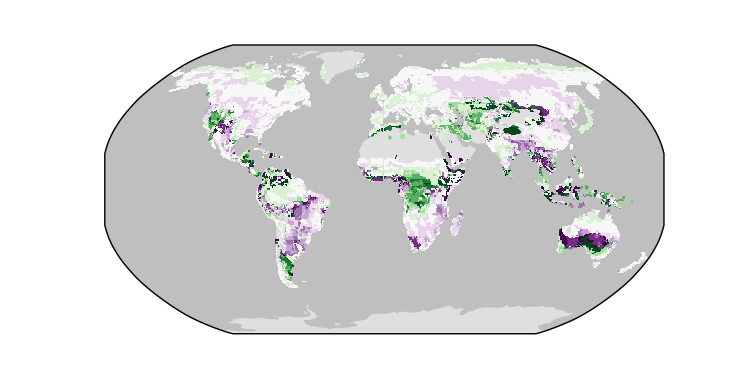
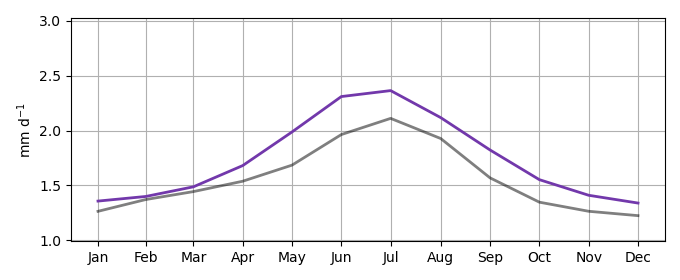
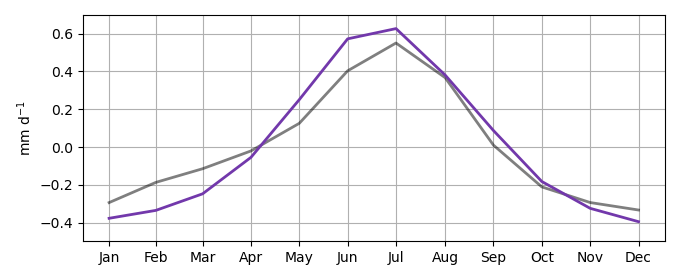
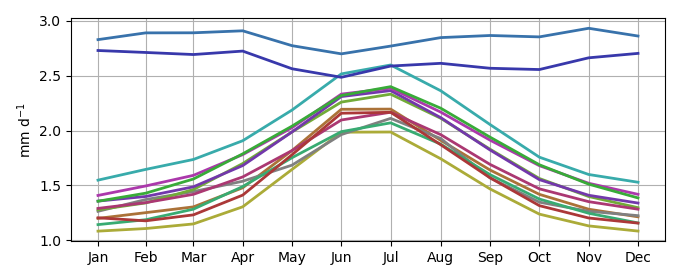
Spatially integrated regional mean click to collapse contents