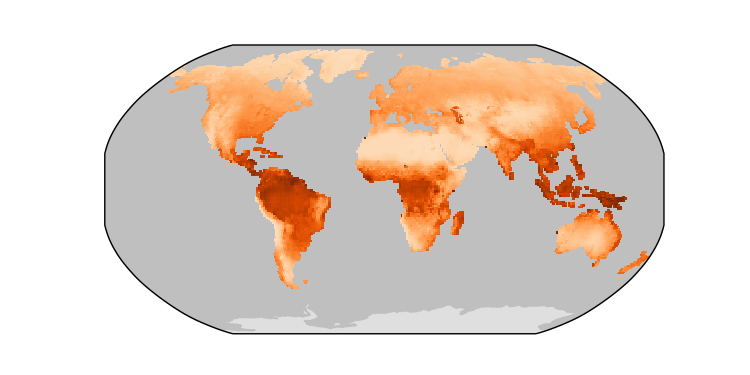
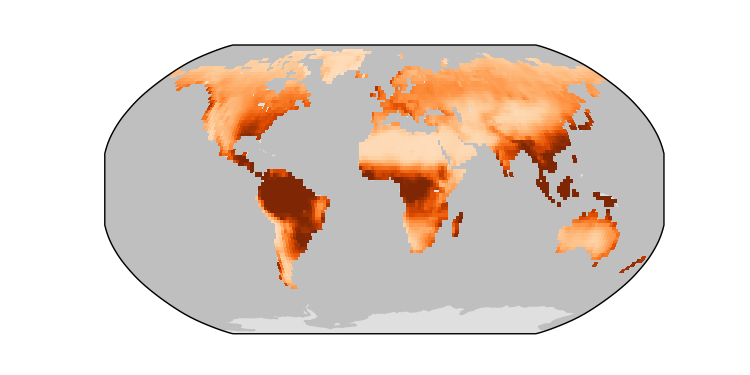
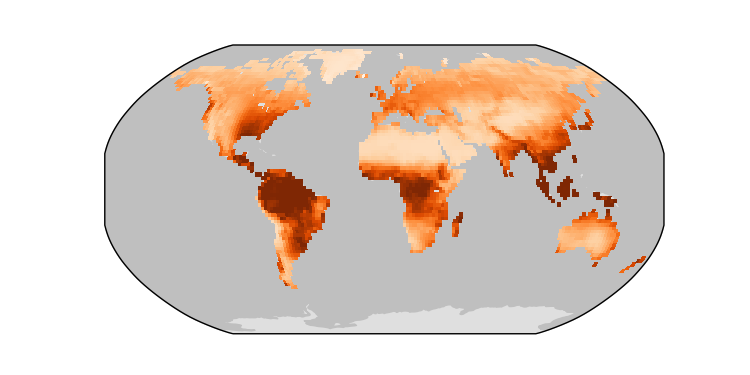
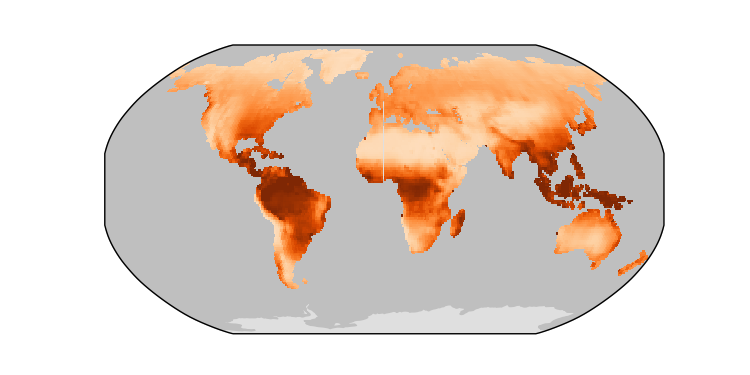
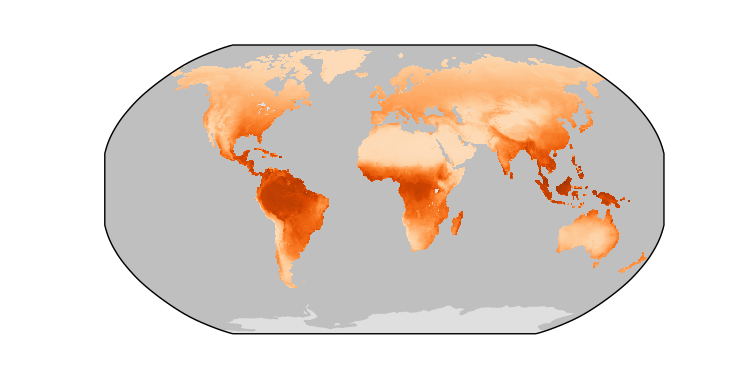
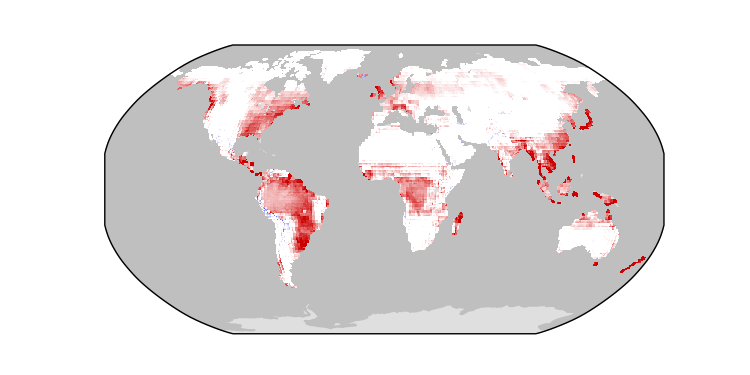
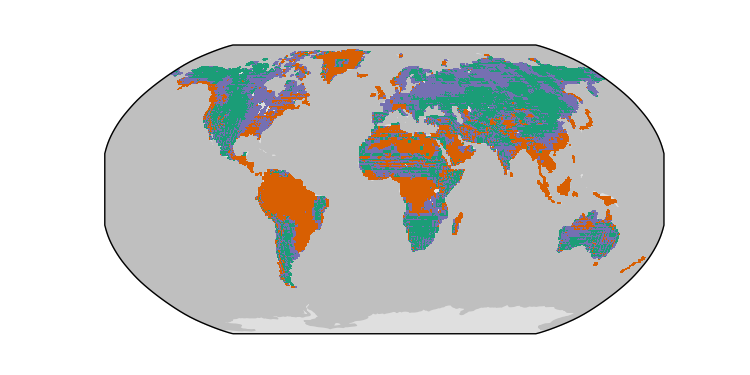
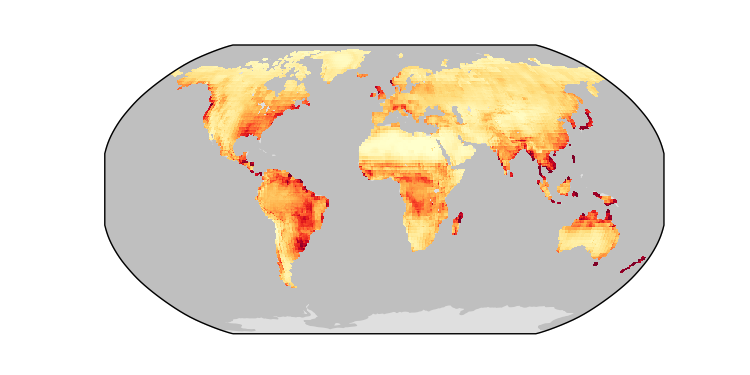
LatentHeat / DOLCE / 2000-2010 / global / JSBACH-Princeton
Global - Land
CLM-CRUJRA
Download Data |
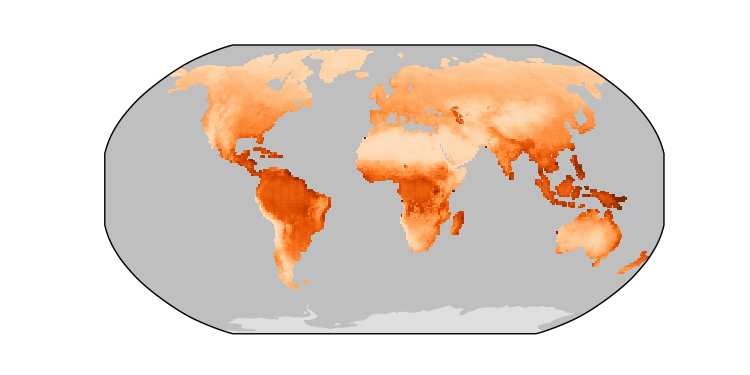
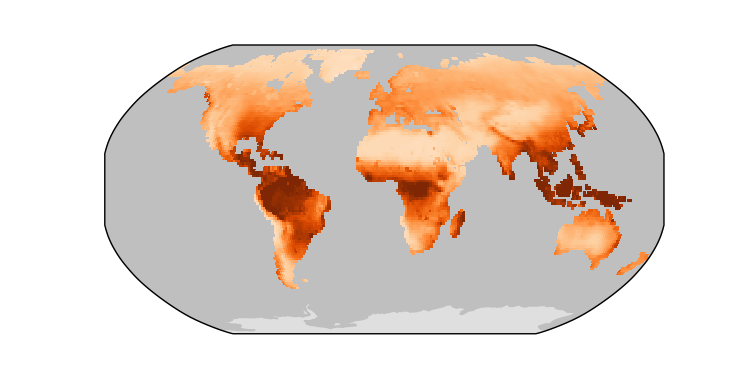
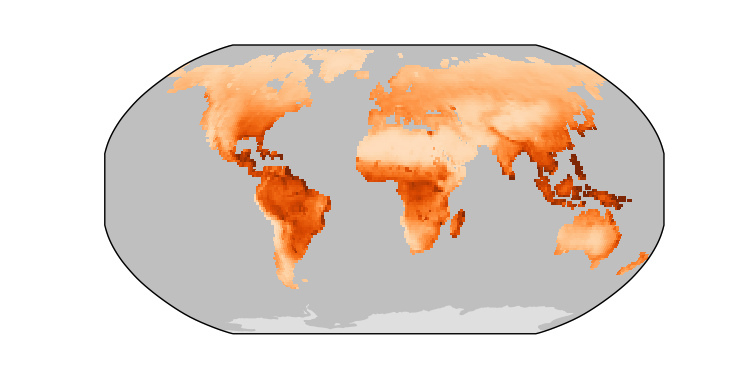
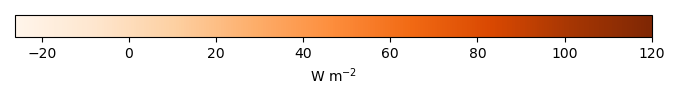
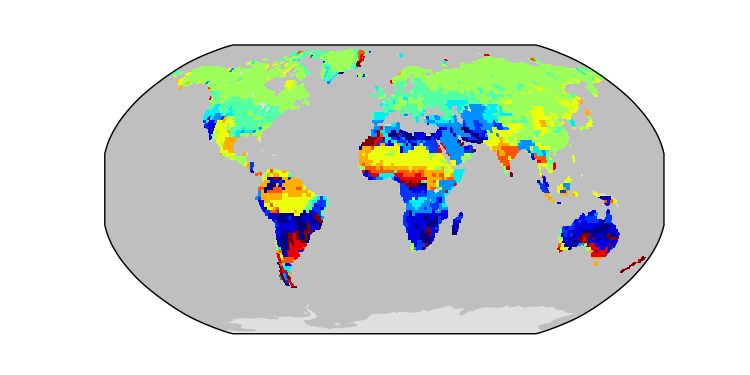
Period Mean (original grids) [W m-2] |
Model Period Mean (intersection) [W m-2] |
Benchmark Period Mean (intersection) [W m-2] |
Model Period Mean (complement) [W m-2] |
Benchmark Period Mean (complement) [W m-2] |
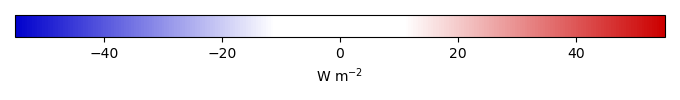
Bias [W m-2] |
RMSE [W m-2] |
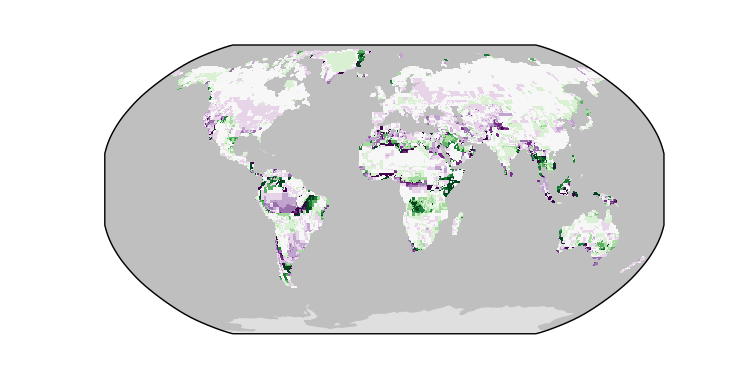
Phase Shift [months] |
Bias Score [1] |
RMSE Score [1] |
Seasonal Cycle Score [1] |
Spatial Distribution Score [1] |
Overall Score [1] |
|||
|---|---|---|---|---|---|---|---|---|---|---|---|---|---|---|---|---|
| Benchmark | [-] | 22.5 | ||||||||||||||
| CLM-CRUJRA | [-] | 27.0 | 27.4 | 22.5 | 25.3 | 13.7 | 4.90 | 10.6 | 0.324 | 0.787 | 0.696 | 0.978 | 0.982 | 0.828 | ||
| CLM-GSWP3 | [-] | 25.2 | 25.7 | 22.5 | 21.6 | 13.7 | 3.22 | 11.7 | 0.347 | 0.806 | 0.648 | 0.976 | 0.911 | 0.797 | ||
| CLM-Princeton | [-] | 22.5 | 22.9 | 22.5 | 20.0 | 13.7 | 0.482 | 8.20 | 0.259 | 0.874 | 0.725 | 0.982 | 0.992 | 0.860 | ||
| ISBA-CTRIP-CRUJRA | [-] | 28.3 | 28.5 | 22.5 | 27.0 | 10.4 | 6.10 | 13.4 | 0.300 | 0.768 | 0.615 | 0.979 | 0.954 | 0.786 | ||
| ISBA-CTRIP-GSWP3 | [-] | 26.7 | 27.2 | 22.5 | 24.6 | 10.4 | 4.69 | 15.5 | 0.434 | 0.787 | 0.549 | 0.967 | 0.890 | 0.749 | ||
| ISBA-CTRIP-Princeton | [-] | 22.8 | 23.2 | 22.5 | 21.4 | 10.4 | 0.730 | 9.50 | 0.209 | 0.873 | 0.686 | 0.984 | 0.986 | 0.843 | ||
| JSBACH-CRUJRA | [-] | 36.4 | 36.7 | 22.6 | 37.5 | 19.3 | 14.1 | 21.7 | 0.519 | 0.575 | 0.522 | 0.962 | 0.625 | 0.641 | ||
| JSBACH-GSWP3 | [-] | 31.5 | 32.0 | 22.6 | 30.1 | 19.3 | 9.42 | 20.8 | 0.597 | 0.662 | 0.477 | 0.957 | 0.666 | 0.648 | ||
| JSBACH-Princeton | [-] | 34.0 | 34.3 | 22.6 | 35.0 | 19.3 | 11.8 | 18.2 | 0.255 | 0.617 | 0.589 | 0.981 | 0.661 | 0.688 | ||
| Mean-CRUJRA | [-] | 30.1 | 30.8 | 22.5 | 28.9 | 10.4 | 8.32 | 13.3 | 0.323 | 0.703 | 0.658 | 0.978 | 0.943 | 0.788 | ||
| Mean-GSWP3 | [-] | 27.3 | 28.2 | 22.5 | 24.8 | 10.4 | 5.71 | 14.4 | 0.399 | 0.759 | 0.587 | 0.971 | 0.880 | 0.757 | ||
| Mean-Princeton | [-] | 26.0 | 26.8 | 22.5 | 24.3 | 10.4 | 4.29 | 9.04 | 0.135 | 0.813 | 0.727 | 0.991 | 0.977 | 0.847 |
Download Data |
Period Mean (original grids) [W m-2] |
Model Period Mean (intersection) [W m-2] |
Benchmark Period Mean (intersection) [W m-2] |
Model Period Mean (complement) [W m-2] |
Benchmark Period Mean (complement) [W m-2] |
Bias [W m-2] |
RMSE [W m-2] |
Phase Shift [months] |
Bias Score [1] |
RMSE Score [1] |
Seasonal Cycle Score [1] |
Spatial Distribution Score [1] |
Overall Score [1] |
|||
|---|---|---|---|---|---|---|---|---|---|---|---|---|---|---|---|---|
| Benchmark | [-] | 35.1 | ||||||||||||||
| CLM-CRUJRA | [-] | 42.9 | 39.0 | 35.1 | 49.5 | 40.0 | 3.94 | 12.9 | 0.996 | 0.648 | 0.458 | 0.811 | 0.991 | 0.673 | ||
| CLM-GSWP3 | [-] | 41.1 | 37.3 | 35.1 | 47.1 | 40.0 | 2.19 | 13.0 | 0.874 | 0.657 | 0.455 | 0.863 | 0.991 | 0.684 | ||
| CLM-Princeton | [-] | 38.7 | 34.9 | 35.1 | 46.3 | 40.0 | -0.232 | 12.6 | 0.939 | 0.613 | 0.477 | 0.835 | 0.982 | 0.677 | ||
| ISBA-CTRIP-CRUJRA | [-] | 46.6 | 44.4 | 35.1 | 56.3 | 43.6 | 9.37 | 17.5 | 0.828 | 0.488 | 0.395 | 0.870 | 0.934 | 0.616 | ||
| ISBA-CTRIP-GSWP3 | [-] | 43.8 | 42.0 | 35.1 | 52.1 | 43.6 | 6.86 | 17.8 | 0.893 | 0.541 | 0.360 | 0.866 | 0.949 | 0.615 | ||
| ISBA-CTRIP-Princeton | [-] | 39.8 | 37.3 | 35.1 | 50.7 | 43.6 | 2.21 | 14.0 | 0.926 | 0.628 | 0.416 | 0.825 | 0.989 | 0.654 | ||
| JSBACH-CRUJRA | [-] | 52.8 | 50.2 | 34.7 | 62.6 | 45.6 | 15.5 | 25.1 | 0.953 | 0.372 | 0.323 | 0.854 | 0.847 | 0.544 | ||
| JSBACH-GSWP3 | [-] | 50.7 | 48.0 | 34.7 | 58.4 | 45.6 | 13.3 | 23.8 | 0.993 | 0.401 | 0.302 | 0.841 | 0.856 | 0.541 | ||
| JSBACH-Princeton | [-] | 50.2 | 47.6 | 34.7 | 60.2 | 45.6 | 12.9 | 22.3 | 0.923 | 0.394 | 0.341 | 0.843 | 0.880 | 0.560 | ||
| Mean-CRUJRA | [-] | 47.0 | 44.7 | 35.2 | 57.1 | 24.1 | 9.55 | 15.6 | 0.776 | 0.475 | 0.454 | 0.870 | 0.947 | 0.640 | ||
| Mean-GSWP3 | [-] | 44.6 | 42.6 | 35.2 | 53.6 | 24.1 | 7.39 | 15.3 | 0.770 | 0.530 | 0.420 | 0.883 | 0.957 | 0.642 | ||
| Mean-Princeton | [-] | 42.4 | 40.0 | 35.2 | 52.9 | 24.1 | 4.85 | 12.0 | 0.756 | 0.626 | 0.483 | 0.867 | 0.987 | 0.689 |
Download Data |
Period Mean (original grids) [W m-2] |
Model Period Mean (intersection) [W m-2] |
Benchmark Period Mean (intersection) [W m-2] |
Model Period Mean (complement) [W m-2] |
Benchmark Period Mean (complement) [W m-2] |
Bias [W m-2] |
RMSE [W m-2] |
Phase Shift [months] |
Bias Score [1] |
RMSE Score [1] |
Seasonal Cycle Score [1] |
Spatial Distribution Score [1] |
Overall Score [1] |
|||
|---|---|---|---|---|---|---|---|---|---|---|---|---|---|---|---|---|
| Benchmark | [-] | 13.0 | ||||||||||||||
| CLM-CRUJRA | [-] | 17.4 | 17.1 | 13.0 | 21.1 | 20.6 | 4.07 | 10.3 | 1.18 | 0.631 | 0.438 | 0.893 | 0.968 | 0.674 | ||
| CLM-GSWP3 | [-] | 16.8 | 16.4 | 13.0 | 19.6 | 20.6 | 3.46 | 9.95 | 1.10 | 0.648 | 0.433 | 0.877 | 0.967 | 0.672 | ||
| CLM-Princeton | [-] | 15.8 | 15.5 | 13.0 | 19.5 | 20.6 | 2.55 | 9.75 | 1.17 | 0.673 | 0.434 | 0.868 | 0.973 | 0.676 | ||
| ISBA-CTRIP-CRUJRA | [-] | 19.1 | 18.2 | 13.0 | 25.1 | 33.1 | 5.26 | 12.4 | 1.04 | 0.601 | 0.364 | 0.918 | 0.940 | 0.637 | ||
| ISBA-CTRIP-GSWP3 | [-] | 18.2 | 17.4 | 13.0 | 21.9 | 33.1 | 4.50 | 13.5 | 1.04 | 0.598 | 0.323 | 0.901 | 0.926 | 0.614 | ||
| ISBA-CTRIP-Princeton | [-] | 17.6 | 16.8 | 13.0 | 22.7 | 33.1 | 3.84 | 12.1 | 1.06 | 0.638 | 0.358 | 0.896 | 0.937 | 0.637 | ||
| JSBACH-CRUJRA | [-] | 18.1 | 18.1 | 13.0 | 18.7 | 13.8 | 5.18 | 14.2 | 1.08 | 0.585 | 0.298 | 0.898 | 0.922 | 0.600 | ||
| JSBACH-GSWP3 | [-] | 17.8 | 17.8 | 13.0 | 18.5 | 13.8 | 4.82 | 13.9 | 1.07 | 0.581 | 0.308 | 0.891 | 0.910 | 0.600 | ||
| JSBACH-Princeton | [-] | 16.7 | 16.7 | 13.0 | 17.2 | 13.8 | 3.77 | 13.1 | 1.07 | 0.622 | 0.320 | 0.885 | 0.927 | 0.615 | ||
| Mean-CRUJRA | [-] | 18.5 | 17.9 | 13.1 | 25.2 | 6.94 | 4.82 | 10.7 | 0.959 | 0.621 | 0.424 | 0.927 | 0.962 | 0.672 | ||
| Mean-GSWP3 | [-] | 17.8 | 17.3 | 13.1 | 22.2 | 6.94 | 4.24 | 10.9 | 0.891 | 0.623 | 0.404 | 0.922 | 0.957 | 0.662 | ||
| Mean-Princeton | [-] | 17.1 | 16.5 | 13.1 | 23.2 | 6.94 | 3.40 | 9.96 | 0.945 | 0.664 | 0.431 | 0.916 | 0.966 | 0.682 |
Download Data |
Period Mean (original grids) [W m-2] |
Model Period Mean (intersection) [W m-2] |
Benchmark Period Mean (intersection) [W m-2] |
Model Period Mean (complement) [W m-2] |
Benchmark Period Mean (complement) [W m-2] |
Bias [W m-2] |
RMSE [W m-2] |
Phase Shift [months] |
Bias Score [1] |
RMSE Score [1] |
Seasonal Cycle Score [1] |
Spatial Distribution Score [1] |
Overall Score [1] |
|||
|---|---|---|---|---|---|---|---|---|---|---|---|---|---|---|---|---|
| Benchmark | [-] | 12.1 | ||||||||||||||
| CLM-CRUJRA | [-] | 15.7 | 15.3 | 12.1 | 26.3 | 22.0 | 3.33 | 10.5 | 0.802 | 0.647 | 0.382 | 0.920 | 0.940 | 0.654 | ||
| CLM-GSWP3 | [-] | 14.4 | 14.0 | 12.1 | 26.3 | 22.0 | 2.12 | 9.51 | 0.910 | 0.647 | 0.406 | 0.924 | 0.885 | 0.653 | ||
| CLM-Princeton | [-] | 14.5 | 14.1 | 12.1 | 24.7 | 22.0 | 2.11 | 10.4 | 0.790 | 0.667 | 0.370 | 0.920 | 0.935 | 0.652 | ||
| ISBA-CTRIP-CRUJRA | [-] | 16.1 | 15.7 | 12.1 | 22.0 | 3.62 | 10.5 | 0.668 | 0.635 | 0.368 | 0.924 | 0.969 | 0.653 | |||
| ISBA-CTRIP-GSWP3 | [-] | 14.4 | 13.8 | 12.1 | 21.3 | 1.75 | 10.9 | 1.08 | 0.649 | 0.326 | 0.891 | 0.902 | 0.619 | |||
| ISBA-CTRIP-Princeton | [-] | 14.4 | 13.9 | 12.1 | 20.1 | 1.81 | 10.5 | 0.651 | 0.670 | 0.349 | 0.922 | 0.963 | 0.651 | |||
| JSBACH-CRUJRA | [-] | 15.1 | 14.7 | 12.0 | 22.4 | 17.1 | 2.73 | 11.6 | 0.902 | 0.660 | 0.301 | 0.874 | 0.971 | 0.621 | ||
| JSBACH-GSWP3 | [-] | 14.1 | 13.6 | 12.0 | 22.3 | 17.1 | 1.53 | 11.0 | 0.975 | 0.661 | 0.307 | 0.890 | 0.942 | 0.621 | ||
| JSBACH-Princeton | [-] | 13.8 | 13.4 | 12.0 | 21.0 | 17.1 | 1.41 | 11.1 | 0.851 | 0.684 | 0.307 | 0.883 | 0.971 | 0.631 | ||
| Mean-CRUJRA | [-] | 15.7 | 15.2 | 12.1 | 22.9 | 12.8 | 3.11 | 8.62 | 0.506 | 0.671 | 0.446 | 0.947 | 0.975 | 0.697 | ||
| Mean-GSWP3 | [-] | 14.4 | 13.7 | 12.1 | 22.4 | 12.8 | 1.67 | 8.45 | 0.848 | 0.678 | 0.421 | 0.925 | 0.956 | 0.680 | ||
| Mean-Princeton | [-] | 14.3 | 13.7 | 12.1 | 21.3 | 12.8 | 1.65 | 8.37 | 0.547 | 0.698 | 0.438 | 0.938 | 0.976 | 0.698 |
Download Data |
Period Mean (original grids) [W m-2] |
Model Period Mean (intersection) [W m-2] |
Benchmark Period Mean (intersection) [W m-2] |
Model Period Mean (complement) [W m-2] |
Benchmark Period Mean (complement) [W m-2] |
Bias [W m-2] |
RMSE [W m-2] |
Phase Shift [months] |
Bias Score [1] |
RMSE Score [1] |
Seasonal Cycle Score [1] |
Spatial Distribution Score [1] |
Overall Score [1] |
|||
|---|---|---|---|---|---|---|---|---|---|---|---|---|---|---|---|---|
| Benchmark | [-] | 46.4 | ||||||||||||||
| CLM-CRUJRA | [-] | 52.9 | 60.5 | 47.0 | 42.9 | 25.6 | 14.1 | 18.6 | 1.26 | 0.327 | 0.358 | 0.740 | 0.958 | 0.548 | ||
| CLM-GSWP3 | [-] | 45.8 | 53.9 | 47.0 | 32.6 | 25.6 | 7.00 | 14.1 | 1.12 | 0.425 | 0.389 | 0.786 | 0.937 | 0.585 | ||
| CLM-Princeton | [-] | 41.0 | 47.2 | 47.0 | 34.0 | 25.6 | 0.347 | 10.7 | 1.09 | 0.507 | 0.461 | 0.782 | 0.987 | 0.640 | ||
| ISBA-CTRIP-CRUJRA | [-] | 61.1 | 68.5 | 46.4 | 60.9 | 32.4 | 23.2 | 26.9 | 1.32 | 0.223 | 0.322 | 0.779 | 0.887 | 0.507 | ||
| ISBA-CTRIP-GSWP3 | [-] | 48.9 | 55.1 | 46.4 | 49.0 | 32.4 | 9.59 | 16.9 | 1.42 | 0.419 | 0.330 | 0.756 | 0.939 | 0.555 | ||
| ISBA-CTRIP-Princeton | [-] | 43.2 | 45.5 | 46.4 | 46.1 | 32.4 | -0.212 | 15.4 | 1.43 | 0.399 | 0.398 | 0.746 | 0.970 | 0.582 | ||
| JSBACH-CRUJRA | [-] | 88.2 | 96.8 | 47.5 | 72.4 | 41.0 | 49.1 | 54.0 | 1.41 | 0.0640 | 0.198 | 0.733 | 0.880 | 0.415 | ||
| JSBACH-GSWP3 | [-] | 65.4 | 77.6 | 47.5 | 53.0 | 41.0 | 30.3 | 39.7 | 1.61 | 0.210 | 0.181 | 0.711 | 0.795 | 0.416 | ||
| JSBACH-Princeton | [-] | 74.7 | 82.4 | 47.5 | 64.0 | 41.0 | 34.8 | 39.0 | 2.05 | 0.113 | 0.279 | 0.600 | 0.966 | 0.447 | ||
| Mean-CRUJRA | [-] | 68.9 | 72.9 | 46.4 | 60.5 | 26.4 | 29.8 | 1.43 | 0.196 | 0.338 | 0.709 | 0.946 | 0.506 | |||
| Mean-GSWP3 | [-] | 57.9 | 61.0 | 46.4 | 48.8 | 14.6 | 20.1 | 1.11 | 0.358 | 0.345 | 0.793 | 0.944 | 0.557 | |||
| Mean-Princeton | [-] | 54.6 | 56.0 | 46.4 | 48.6 | 9.55 | 14.7 | 1.22 | 0.484 | 0.434 | 0.751 | 0.973 | 0.615 |
Download Data |
Period Mean (original grids) [W m-2] |
Model Period Mean (intersection) [W m-2] |
Benchmark Period Mean (intersection) [W m-2] |
Model Period Mean (complement) [W m-2] |
Benchmark Period Mean (complement) [W m-2] |
Bias [W m-2] |
RMSE [W m-2] |
Phase Shift [months] |
Bias Score [1] |
RMSE Score [1] |
Seasonal Cycle Score [1] |
Spatial Distribution Score [1] |
Overall Score [1] |
|||
|---|---|---|---|---|---|---|---|---|---|---|---|---|---|---|---|---|
| Benchmark | [-] | 39.7 | ||||||||||||||
| CLM-CRUJRA | [-] | 44.1 | 43.9 | 39.7 | 45.6 | 26.4 | 4.16 | 12.7 | 0.437 | 0.792 | 0.671 | 0.959 | 0.990 | 0.816 | ||
| CLM-GSWP3 | [-] | 41.4 | 41.3 | 39.7 | 41.6 | 26.4 | 1.49 | 13.0 | 0.462 | 0.795 | 0.665 | 0.953 | 0.988 | 0.813 | ||
| CLM-Princeton | [-] | 39.0 | 38.7 | 39.7 | 40.7 | 26.4 | -0.965 | 11.3 | 0.408 | 0.811 | 0.691 | 0.955 | 0.977 | 0.825 | ||
| ISBA-CTRIP-CRUJRA | [-] | 51.9 | 51.8 | 39.7 | 53.2 | 37.8 | 12.1 | 19.4 | 0.594 | 0.609 | 0.577 | 0.948 | 0.867 | 0.716 | ||
| ISBA-CTRIP-GSWP3 | [-] | 49.2 | 49.2 | 39.7 | 49.4 | 37.8 | 9.57 | 18.8 | 0.665 | 0.674 | 0.574 | 0.937 | 0.892 | 0.730 | ||
| ISBA-CTRIP-Princeton | [-] | 45.1 | 44.8 | 39.7 | 46.1 | 37.8 | 5.15 | 13.6 | 0.499 | 0.760 | 0.648 | 0.944 | 0.945 | 0.789 | ||
| JSBACH-CRUJRA | [-] | 65.5 | 64.7 | 39.7 | 70.7 | 40.2 | 24.9 | 33.8 | 0.811 | 0.406 | 0.455 | 0.924 | 0.685 | 0.585 | ||
| JSBACH-GSWP3 | [-] | 62.5 | 62.0 | 39.7 | 65.4 | 40.2 | 22.3 | 31.4 | 0.761 | 0.454 | 0.473 | 0.920 | 0.753 | 0.615 | ||
| JSBACH-Princeton | [-] | 64.1 | 63.2 | 39.7 | 69.5 | 40.2 | 23.5 | 31.0 | 0.642 | 0.424 | 0.510 | 0.935 | 0.710 | 0.618 | ||
| Mean-CRUJRA | [-] | 52.7 | 53.2 | 39.7 | 54.1 | 38.9 | 13.5 | 19.1 | 0.569 | 0.587 | 0.611 | 0.951 | 0.915 | 0.735 | ||
| Mean-GSWP3 | [-] | 49.9 | 50.6 | 39.7 | 49.9 | 38.9 | 10.9 | 17.9 | 0.578 | 0.656 | 0.614 | 0.944 | 0.946 | 0.755 | ||
| Mean-Princeton | [-] | 48.0 | 48.7 | 39.7 | 48.6 | 38.9 | 8.98 | 14.3 | 0.424 | 0.692 | 0.678 | 0.958 | 0.956 | 0.792 |
Download Data |
Period Mean (original grids) [W m-2] |
Model Period Mean (intersection) [W m-2] |
Benchmark Period Mean (intersection) [W m-2] |
Model Period Mean (complement) [W m-2] |
Benchmark Period Mean (complement) [W m-2] |
Bias [W m-2] |
RMSE [W m-2] |
Phase Shift [months] |
Bias Score [1] |
RMSE Score [1] |
Seasonal Cycle Score [1] |
Spatial Distribution Score [1] |
Overall Score [1] |
|||
|---|---|---|---|---|---|---|---|---|---|---|---|---|---|---|---|---|
| Benchmark | [-] | 89.0 | ||||||||||||||
| CLM-CRUJRA | [-] | 97.8 | 97.3 | 89.1 | 101. | 76.5 | 8.20 | 15.2 | 2.77 | 0.344 | 0.222 | 0.529 | 0.977 | 0.459 | ||
| CLM-GSWP3 | [-] | 93.2 | 92.7 | 89.1 | 96.9 | 76.5 | 3.59 | 11.0 | 1.51 | 0.502 | 0.265 | 0.779 | 0.988 | 0.560 | ||
| CLM-Princeton | [-] | 79.6 | 77.2 | 89.1 | 94.9 | 76.5 | -11.9 | 17.3 | 1.60 | 0.176 | 0.331 | 0.770 | 0.979 | 0.517 | ||
| ISBA-CTRIP-CRUJRA | [-] | 123. | 123. | 89.0 | 122. | 94.9 | 33.8 | 36.1 | 2.14 | 0.0365 | 0.193 | 0.648 | 0.751 | 0.364 | ||
| ISBA-CTRIP-GSWP3 | [-] | 116. | 114. | 89.0 | 118. | 94.9 | 24.4 | 30.7 | 1.63 | 0.0940 | 0.0937 | 0.770 | 0.593 | 0.329 | ||
| ISBA-CTRIP-Princeton | [-] | 87.4 | 80.4 | 89.0 | 113. | 94.9 | -8.55 | 19.4 | 2.01 | 0.208 | 0.194 | 0.690 | 0.766 | 0.410 | ||
| JSBACH-CRUJRA | [-] | 140. | 140. | 89.2 | 150. | 87.3 | 51.1 | 52.7 | 1.98 | 0.00731 | 0.185 | 0.675 | 0.820 | 0.374 | ||
| JSBACH-GSWP3 | [-] | 131. | 130. | 89.2 | 144. | 87.3 | 41.0 | 47.5 | 1.93 | 0.0276 | 0.0465 | 0.710 | 0.422 | 0.251 | ||
| JSBACH-Princeton | [-] | 120. | 120. | 89.2 | 136. | 87.3 | 30.8 | 33.0 | 1.94 | 0.0227 | 0.184 | 0.707 | 0.758 | 0.371 | ||
| Mean-CRUJRA | [-] | 119. | 119. | 89.0 | 120. | 29.8 | 31.5 | 2.02 | 0.0416 | 0.241 | 0.671 | 0.954 | 0.430 | |||
| Mean-GSWP3 | [-] | 112. | 111. | 89.0 | 117. | 22.2 | 26.4 | 1.67 | 0.0848 | 0.132 | 0.758 | 0.829 | 0.387 | |||
| Mean-Princeton | [-] | 95.6 | 91.0 | 89.0 | 115. | 2.05 | 12.3 | 1.71 | 0.383 | 0.284 | 0.747 | 0.948 | 0.529 |
Download Data |
Period Mean (original grids) [W m-2] |
Model Period Mean (intersection) [W m-2] |
Benchmark Period Mean (intersection) [W m-2] |
Model Period Mean (complement) [W m-2] |
Benchmark Period Mean (complement) [W m-2] |
Bias [W m-2] |
RMSE [W m-2] |
Phase Shift [months] |
Bias Score [1] |
RMSE Score [1] |
Seasonal Cycle Score [1] |
Spatial Distribution Score [1] |
Overall Score [1] |
|||
|---|---|---|---|---|---|---|---|---|---|---|---|---|---|---|---|---|
| Benchmark | [-] | 69.8 | ||||||||||||||
| CLM-CRUJRA | [-] | 75.1 | 73.6 | 69.8 | 82.7 | 62.5 | 3.82 | 17.4 | 1.67 | 0.602 | 0.388 | 0.737 | 0.968 | 0.617 | ||
| CLM-GSWP3 | [-] | 72.6 | 70.9 | 69.8 | 81.8 | 62.5 | 1.11 | 17.6 | 1.38 | 0.591 | 0.387 | 0.809 | 0.963 | 0.628 | ||
| CLM-Princeton | [-] | 68.8 | 66.8 | 69.8 | 79.5 | 62.5 | -3.07 | 19.1 | 1.67 | 0.525 | 0.397 | 0.753 | 0.992 | 0.613 | ||
| ISBA-CTRIP-CRUJRA | [-] | 87.4 | 85.4 | 69.8 | 96.4 | 50.5 | 15.6 | 26.1 | 1.16 | 0.400 | 0.323 | 0.837 | 0.800 | 0.536 | ||
| ISBA-CTRIP-GSWP3 | [-] | 81.9 | 80.2 | 69.8 | 90.0 | 50.5 | 10.5 | 25.2 | 1.28 | 0.478 | 0.295 | 0.820 | 0.785 | 0.535 | ||
| ISBA-CTRIP-Princeton | [-] | 74.2 | 71.1 | 69.8 | 89.0 | 50.5 | 1.34 | 20.2 | 1.67 | 0.580 | 0.329 | 0.742 | 0.982 | 0.592 | ||
| JSBACH-CRUJRA | [-] | 99.5 | 98.2 | 69.7 | 111. | 71.0 | 28.5 | 40.3 | 1.28 | 0.252 | 0.254 | 0.816 | 0.671 | 0.449 | ||
| JSBACH-GSWP3 | [-] | 96.9 | 95.4 | 69.7 | 106. | 71.0 | 25.7 | 37.9 | 1.46 | 0.284 | 0.228 | 0.786 | 0.706 | 0.446 | ||
| JSBACH-Princeton | [-] | 96.0 | 94.3 | 69.7 | 108. | 71.0 | 24.6 | 36.3 | 1.43 | 0.270 | 0.255 | 0.785 | 0.730 | 0.459 | ||
| Mean-CRUJRA | [-] | 87.3 | 85.6 | 69.8 | 94.8 | 60.5 | 15.8 | 22.9 | 1.18 | 0.377 | 0.392 | 0.827 | 0.857 | 0.569 | ||
| Mean-GSWP3 | [-] | 84.1 | 82.1 | 69.8 | 91.3 | 60.5 | 12.3 | 21.5 | 1.12 | 0.454 | 0.360 | 0.846 | 0.870 | 0.578 | ||
| Mean-Princeton | [-] | 79.8 | 77.2 | 69.8 | 90.7 | 60.5 | 7.37 | 17.2 | 1.30 | 0.566 | 0.405 | 0.807 | 0.973 | 0.631 |
Download Data |
Period Mean (original grids) [W m-2] |
Model Period Mean (intersection) [W m-2] |
Benchmark Period Mean (intersection) [W m-2] |
Model Period Mean (complement) [W m-2] |
Benchmark Period Mean (complement) [W m-2] |
Bias [W m-2] |
RMSE [W m-2] |
Phase Shift [months] |
Bias Score [1] |
RMSE Score [1] |
Seasonal Cycle Score [1] |
Spatial Distribution Score [1] |
Overall Score [1] |
|||
|---|---|---|---|---|---|---|---|---|---|---|---|---|---|---|---|---|
| Benchmark | [-] | 12.3 | ||||||||||||||
| CLM-CRUJRA | [-] | 23.3 | 15.8 | 12.3 | 11.8 | 4.41 | 3.45 | 9.56 | 0.262 | 0.802 | 0.621 | 0.987 | 0.969 | 0.800 | ||
| CLM-GSWP3 | [-] | 23.5 | 13.9 | 12.3 | 9.56 | 4.41 | 1.59 | 11.1 | 0.264 | 0.806 | 0.559 | 0.981 | 0.883 | 0.757 | ||
| CLM-Princeton | [-] | 21.7 | 14.0 | 12.3 | 10.2 | 4.41 | 1.69 | 7.23 | 0.206 | 0.868 | 0.692 | 0.991 | 0.984 | 0.845 | ||
| ISBA-CTRIP-CRUJRA | [-] | 15.4 | 16.2 | 12.3 | 11.2 | 5.20 | 3.95 | 10.3 | 0.228 | 0.770 | 0.576 | 0.989 | 0.914 | 0.765 | ||
| ISBA-CTRIP-GSWP3 | [-] | 14.1 | 14.9 | 12.3 | 9.97 | 5.20 | 2.65 | 12.4 | 0.249 | 0.792 | 0.499 | 0.982 | 0.854 | 0.725 | ||
| ISBA-CTRIP-Princeton | [-] | 13.3 | 13.9 | 12.3 | 10.3 | 5.20 | 1.66 | 7.52 | 0.169 | 0.879 | 0.665 | 0.994 | 0.989 | 0.838 | ||
| JSBACH-CRUJRA | [-] | 16.9 | 20.7 | 12.5 | 16.5 | 7.80 | 8.26 | 14.2 | 0.447 | 0.627 | 0.526 | 0.969 | 0.815 | 0.693 | ||
| JSBACH-GSWP3 | [-] | 16.3 | 15.7 | 12.5 | 11.9 | 7.80 | 3.30 | 13.4 | 0.480 | 0.745 | 0.506 | 0.970 | 0.715 | 0.688 | ||
| JSBACH-Princeton | [-] | 17.5 | 19.1 | 12.5 | 14.3 | 7.80 | 6.67 | 12.2 | 0.293 | 0.672 | 0.579 | 0.987 | 0.855 | 0.734 | ||
| Mean-CRUJRA | [-] | 16.4 | 17.4 | 12.3 | 12.4 | 5.13 | 9.20 | 0.212 | 0.735 | 0.651 | 0.990 | 0.923 | 0.790 | |||
| Mean-GSWP3 | [-] | 13.8 | 14.8 | 12.3 | 10.0 | 2.47 | 10.8 | 0.219 | 0.798 | 0.563 | 0.984 | 0.839 | 0.749 | |||
| Mean-Princeton | [-] | 14.7 | 15.5 | 12.3 | 11.0 | 3.27 | 6.87 | 0.159 | 0.815 | 0.721 | 0.996 | 0.984 | 0.847 |
Download Data |
Period Mean (original grids) [W m-2] |
Model Period Mean (intersection) [W m-2] |
Benchmark Period Mean (intersection) [W m-2] |
Model Period Mean (complement) [W m-2] |
Benchmark Period Mean (complement) [W m-2] |
Bias [W m-2] |
RMSE [W m-2] |
Phase Shift [months] |
Bias Score [1] |
RMSE Score [1] |
Seasonal Cycle Score [1] |
Spatial Distribution Score [1] |
Overall Score [1] |
|||
|---|---|---|---|---|---|---|---|---|---|---|---|---|---|---|---|---|
| Benchmark | [-] | 31.1 | ||||||||||||||
| CLM-CRUJRA | [-] | 34.3 | 33.4 | 31.1 | 40.0 | 26.5 | 2.33 | 14.1 | 0.591 | 0.807 | 0.549 | 0.945 | 0.990 | 0.768 | ||
| CLM-GSWP3 | [-] | 33.8 | 32.9 | 31.1 | 38.8 | 26.5 | 1.77 | 14.4 | 0.564 | 0.793 | 0.550 | 0.943 | 0.990 | 0.765 | ||
| CLM-Princeton | [-] | 32.5 | 31.5 | 31.1 | 38.6 | 26.5 | 0.421 | 14.1 | 0.603 | 0.811 | 0.544 | 0.937 | 0.991 | 0.765 | ||
| ISBA-CTRIP-CRUJRA | [-] | 38.2 | 37.2 | 31.1 | 43.2 | 27.3 | 6.01 | 16.4 | 0.635 | 0.710 | 0.507 | 0.948 | 0.917 | 0.718 | ||
| ISBA-CTRIP-GSWP3 | [-] | 37.3 | 36.5 | 31.1 | 41.0 | 27.3 | 5.37 | 17.4 | 0.676 | 0.715 | 0.493 | 0.941 | 0.911 | 0.710 | ||
| ISBA-CTRIP-Princeton | [-] | 35.7 | 34.7 | 31.1 | 41.2 | 27.3 | 3.45 | 15.0 | 0.643 | 0.767 | 0.530 | 0.940 | 0.949 | 0.743 | ||
| JSBACH-CRUJRA | [-] | 38.9 | 38.0 | 31.0 | 46.1 | 35.1 | 7.04 | 20.8 | 0.781 | 0.676 | 0.412 | 0.925 | 0.870 | 0.659 | ||
| JSBACH-GSWP3 | [-] | 40.0 | 39.5 | 31.0 | 46.6 | 35.1 | 8.52 | 20.9 | 0.696 | 0.640 | 0.435 | 0.924 | 0.851 | 0.657 | ||
| JSBACH-Princeton | [-] | 38.0 | 37.1 | 31.0 | 45.9 | 35.1 | 6.12 | 19.8 | 0.769 | 0.689 | 0.435 | 0.920 | 0.873 | 0.670 | ||
| Mean-CRUJRA | [-] | 37.2 | 36.3 | 31.1 | 43.0 | 34.5 | 5.18 | 13.8 | 0.473 | 0.743 | 0.561 | 0.961 | 0.955 | 0.756 | ||
| Mean-GSWP3 | [-] | 37.2 | 36.3 | 31.1 | 41.4 | 34.5 | 5.22 | 14.5 | 0.512 | 0.737 | 0.557 | 0.951 | 0.960 | 0.752 | ||
| Mean-Princeton | [-] | 35.4 | 34.5 | 31.1 | 41.4 | 34.5 | 3.38 | 12.4 | 0.492 | 0.789 | 0.589 | 0.953 | 0.973 | 0.778 |
Temporally integrated period mean click to collapse contents


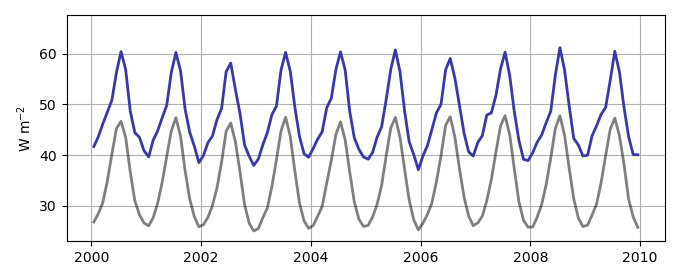
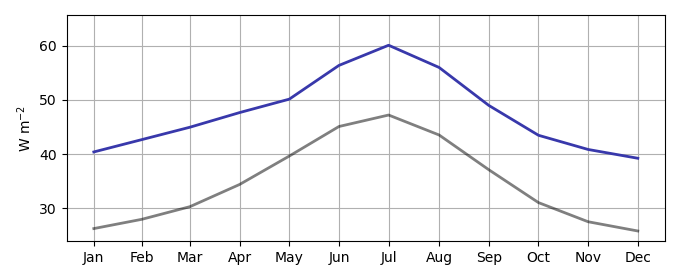
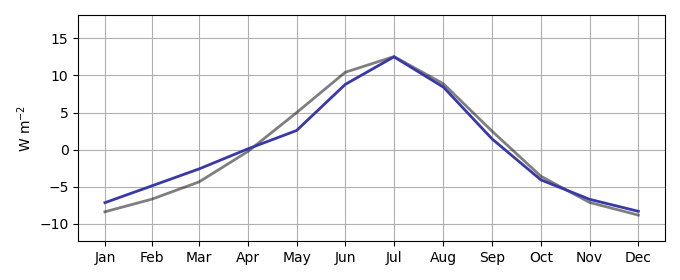
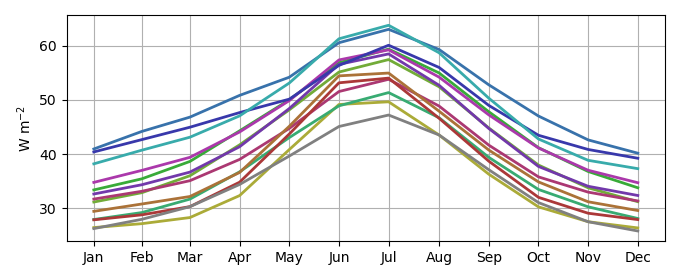
Spatially integrated regional mean click to collapse contents